Computational Study of Time field / Diagram Algorithm
The aim of this study was to create a grasshopper algorithm that can visualize time fields based on .csv files and It is defined to categorize the list of events (or vegetables) and the connection between “What is happening at what time with which amount of number?”
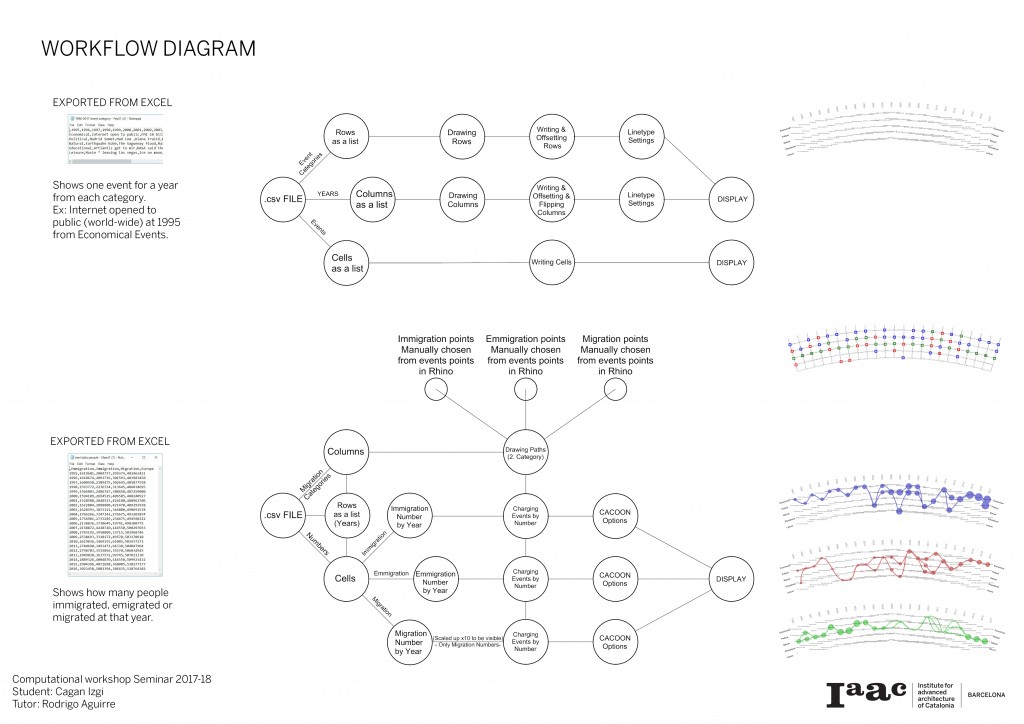
The final result has achieved through two definitions;
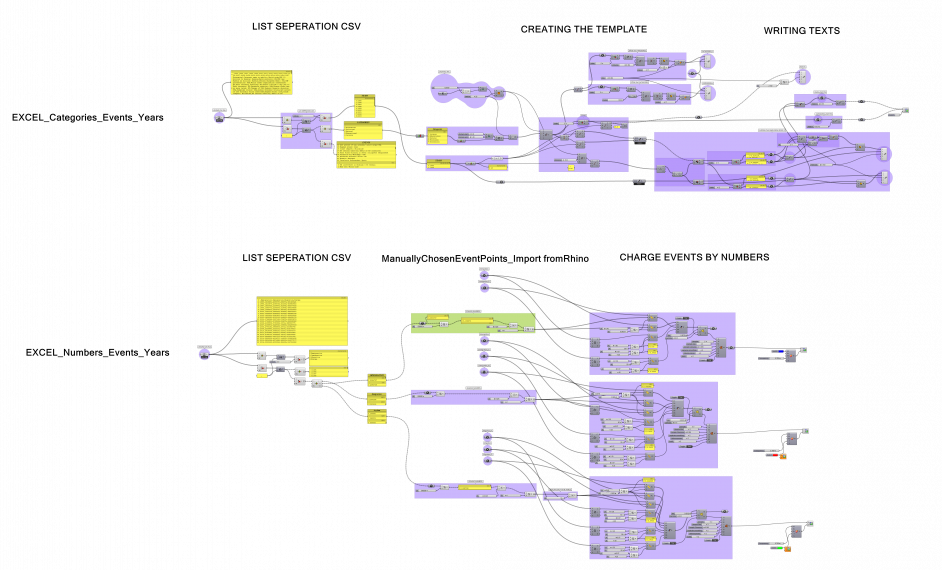
First part is defined to draw the template as rows and columns based on the .csv file that we can import to grasshopper and writing the cells into their positions.
The second part is defined to create the fields and a second layer of categorization by using “Cacoon”.
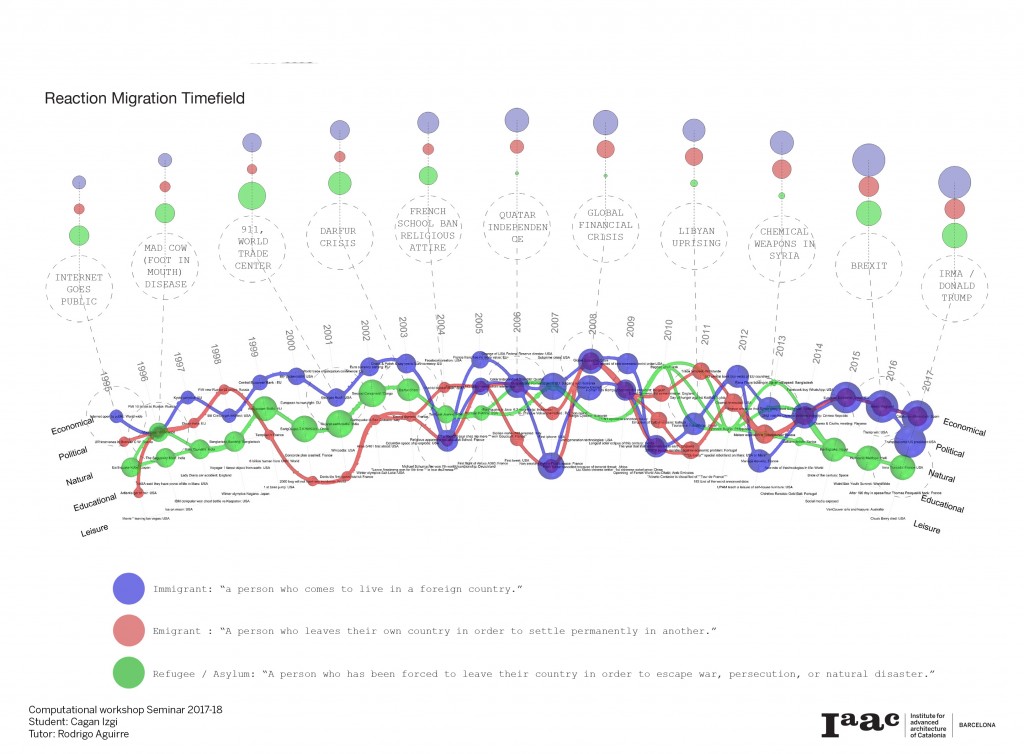
This two algorithms that I defined has used to visualize the timefield based on the .csv files which we(1) produced for the Theory & Knowledge Seminar and The result that you will see below displays the cross-examination of migration statistics in and out of Europe and the ripple effects of global events.
In addition, this algorithm study will allow me to produce diagrams and time fields that we can visualize the categorization of the edible plants into different growing environments and the specifications about them such as growing time and amount of yield… (This is an on-going study for the Self-Sufficient Habitat Thesis Studio which will be posted in the end of July.)
Student: Cagan Izgi
Tutor: Rodrigo Aguirre