In today’s world, data is power. But representing that data in an informative way is also important for a clear and quick understanding. The exercise focuses on representation and extraction of information from data collected over a period of 2 weeks about the movement of self and colleagues. Following was the procedure used:
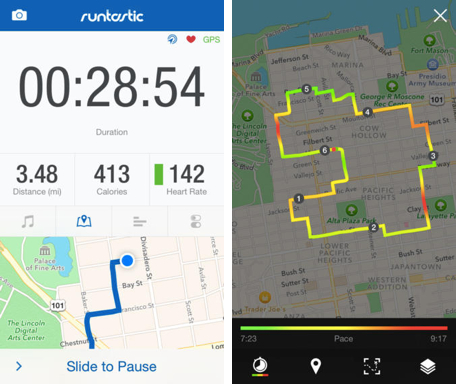
- Download an app which can track you and allows you to export your data in kml,xml,gpx format(runtastic in this case)
2. As runtastic creates a seperate file for each activity, open all your files in google earth and export as kml/xml/gpx(kml in this case) to put all your data in one file.
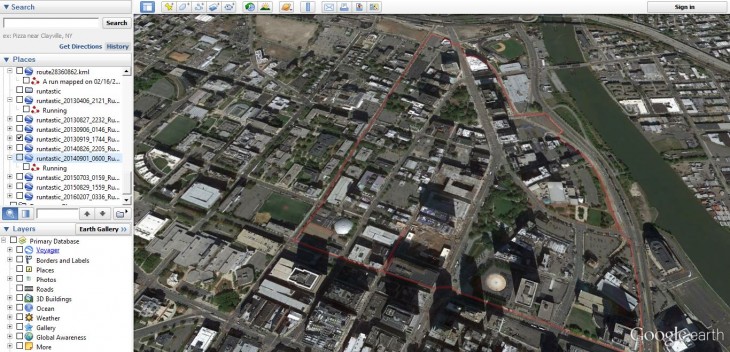
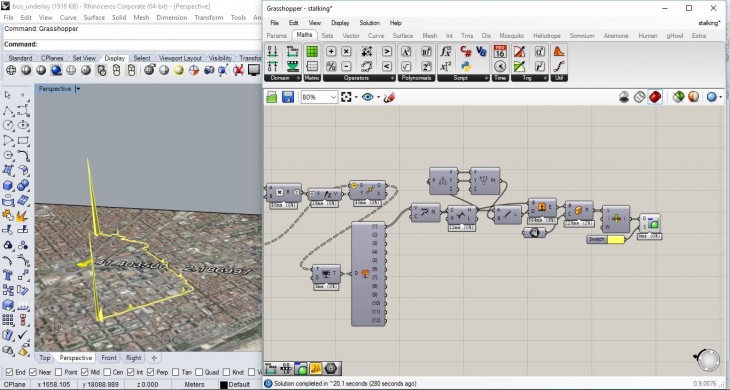
3. Reading combined data of 12 people in kml format in grasshopper
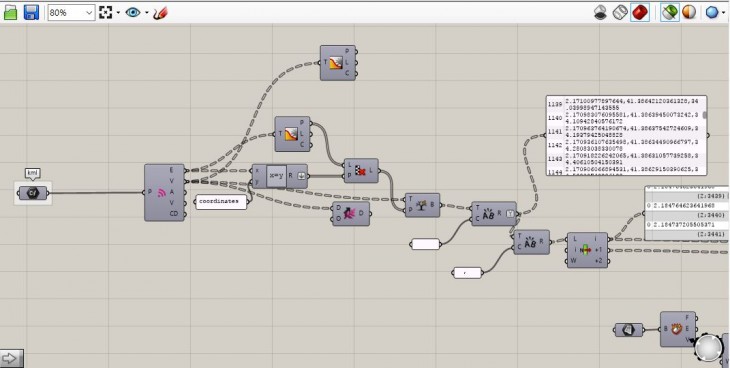
4. Geolocate this data on an undelaying map.
5.The idea was to determine where do people slow down or spend most of there time around. For this, the gelocated points nearby( with a proximity of 5m) were grouped, keeping them in seperate branches.
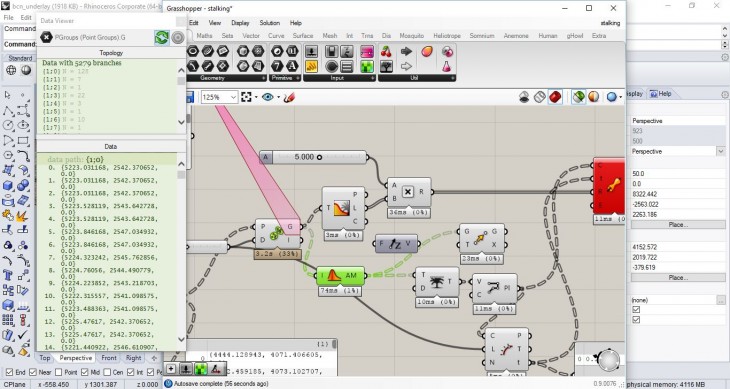
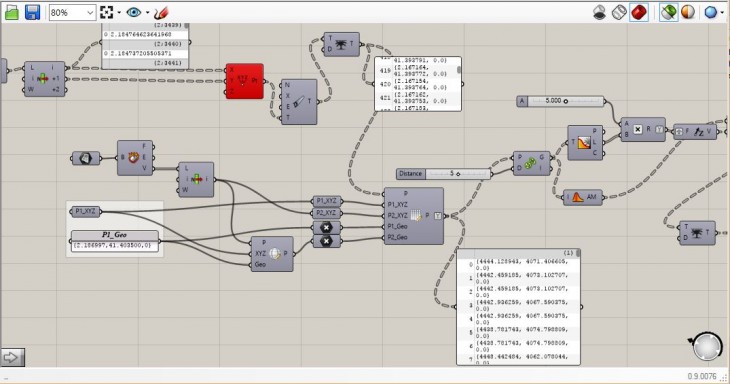
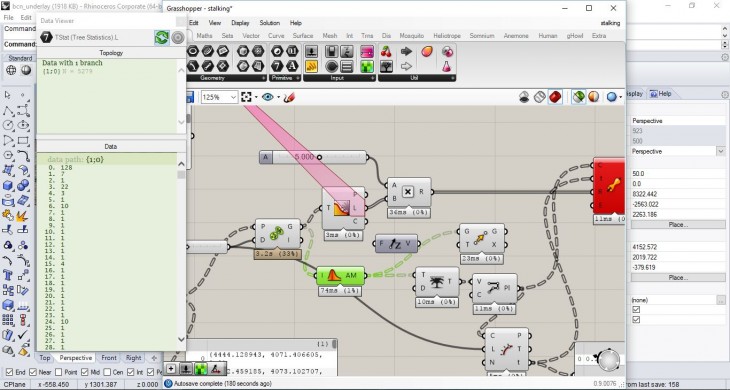
6.Number of members in a group were taken as a parameter based on the logic that apps would track more points when the body is moving in a slow pace.
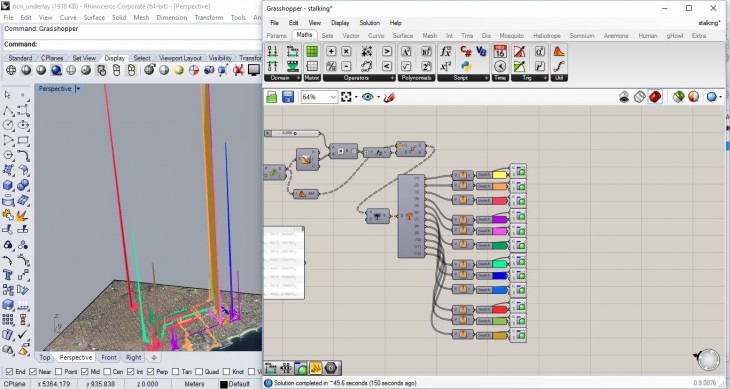
7. For data clarity, average of the points were taken to represent one point for one group.
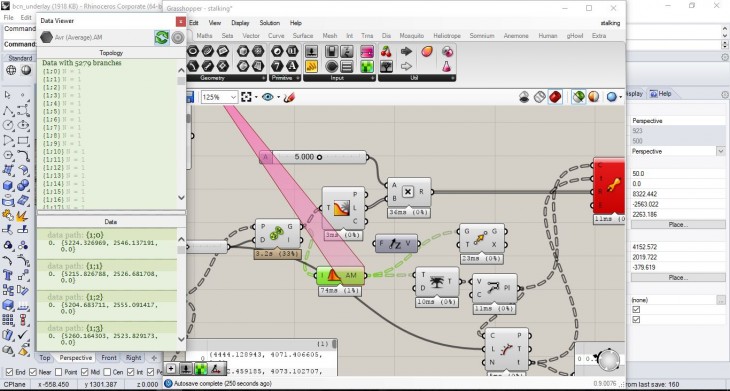
8. keeping the data structure in the original format.
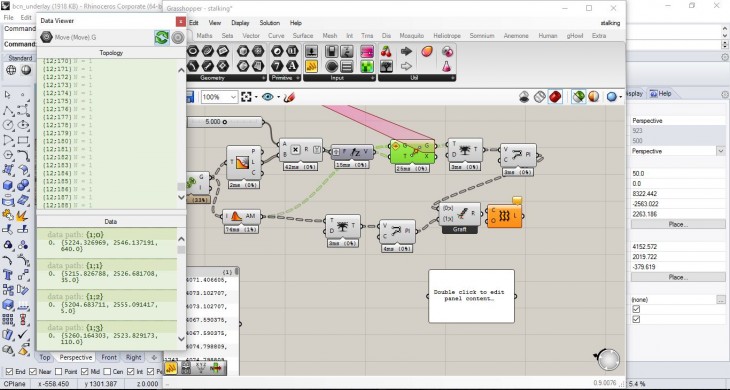
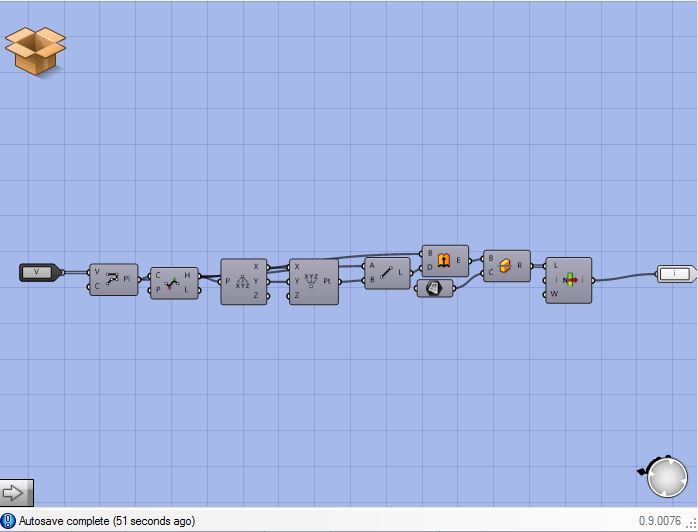
9. Data representation of one journey.
10. Cluster defination.
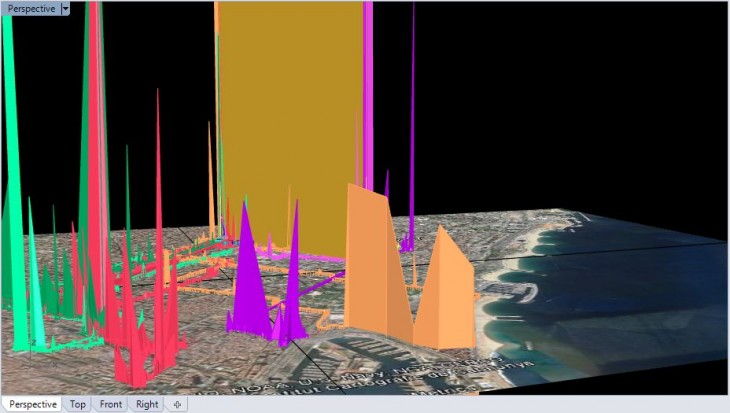
Conclusion:
Different coloured surfaces represent different journeys and height of these surfaces represents how long was the person around that area.

Time spent: Analysis is a project of IaaC, Institute for Advanced Architecture of Catalonia developed at Master of Advanced Architecture in 2015/16 by:
Student:
- Pranay Baj
Faculty:
- Luis Fraguada
- Rodrigo Aguirre