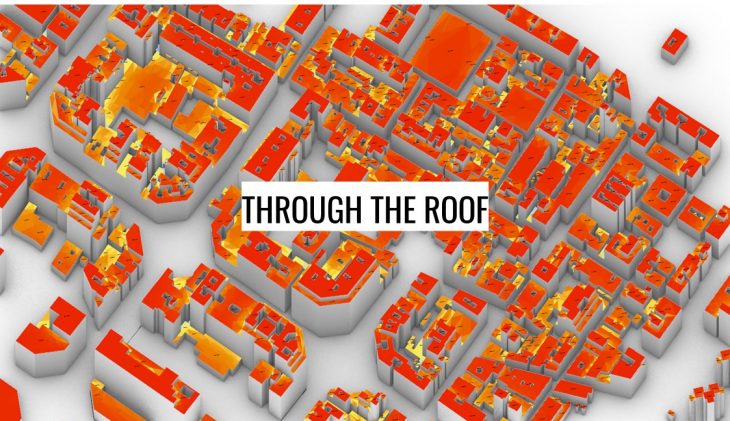
THROUGH THE ROOF
An Energy calculator for planning energy solutions on buildings’ roofs
By 2050, it is estimated that 70% of the world population will live in cities. With this increase comes many other issues, and it is important to study, assess and sometimes simulate potential scenarios in order to plan for solutions in the long run.
Cities are the biggest generator of waste and the biggest consumers of energy in a country, and these two topics have become a global issue for some time. Poor management and recycling systems and in parallel the slow process to shift to a renewable energy production system, has caused an increase in energy consumption, CO2 emissions and ocean pollution, affecting the fauna and flora of our planet. In order to shift away from the traditional and linear way of managing waste in the city and shifting towards a more renewable energy source, this project suggests that recycling should take place where we dispose of our waste: in the urban fabric, and the optimum usage of solar energy on our buildings. In other words, bringing and scaling down the waste facilities into our neighbourhood.
This project will simulate the amount of space required for a waste to energy facility, based on population growth in an urban space and space required for solar panels. The tool will also display the placement of these solutions. First, the components and spatial requirements of this facility will be listed and used as a parameter. The indicators that will be used to visualize future scenarios are the following: population, waste generation per capita, energy consumption per capita, solar energy potential.
Keywords
Waste management, solar energy, renewable energy, urban calculator, roof potential
Methodology
Defining inputs and design space
The tool can be used for different cities with different urban fabrics. During the development phase, the city of Barcelona is chosen to run the tests on urban blocks in Eixample and Poblenou neighbourhoods. The first step in the design inputs is to create the 3D model of a 3 by 3 block in the Eixample district. These 9 blocks will be referred to as the “site”. Next, the contextual data of this residential site, such as the number of population, energy consumption per capita and waste generation per capita is added. The data is taken from the Ajuntament de Barcelona dataset of 2018 and Barcelona Statistica. Then, the energy production methods (solar panel and biogas station) in the tool are embedded. The specifications of two energy production methods are listed in terms of area needed, energy production per hour and capacity. Based on the parameter of scale, the solar panel has a set dimension but the biogas station has two different scales: small and medium scale with 2.5 tonne and 5 tonne capacity respectively.
Performance Evaluation
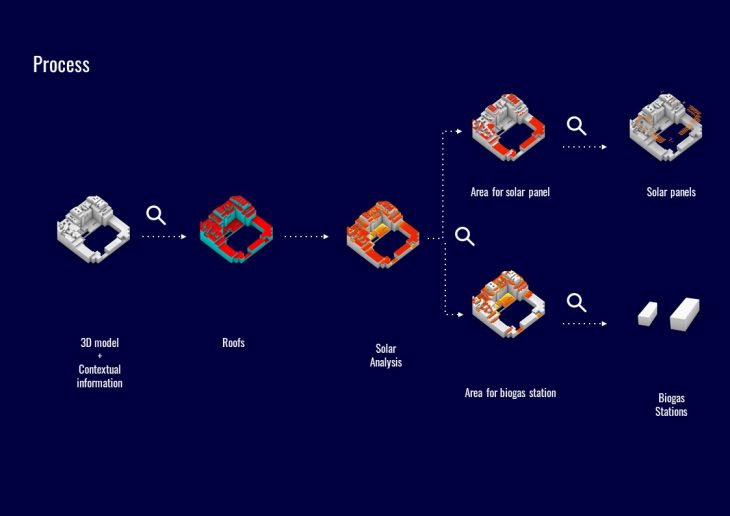
In this step the process for solar potential performance and dedication of areas for energy solution installation is explained:
First, the buildings’ surfaces are separated into roofs and facades. Then a solar potential analysis is conducted on roof spaces with the Ladybug plugin in Grasshopper. Highest potential spaces( spaces with more than 1400Kwh/m2 solar radiation per year) are dedicated to adding solar panels and least potential spaces for anaerobic digestion plants. These limitations allow the tool to calculate the total number of panels and anaerobic plants that can be placed in their assigned spaces.
The areas dedicated to the solar panel installation are filtered through a rectangular grid following the size of the solar panel to calculate the final number of how many solar panels fit on each roof.
Analysis & results
The total energy by solar panels is calculated by the following formula:
E Total = N x E solar panel = N x [ A x r x H x PR ]
- E = Energy (kWh)
- N = Total number of solar panels
- A = Total solar panel area (m2)
- R = Solar panel efficiency (%)
- H = Annual average solar radiation on panels
- PR = Performance Ratio = 0.75
The number of biogas stations and their energy generation is calculated by following the following formulas:
- Number of Population x Organic waste generation/day (0.21kg/day)= Total organic waste/day
- Total organic waste/day x 20 (Days for maximum capacity of digester ) = Total Capacity for digesters
- Total Capacity / Capacity of one digestor = number of digester
Procedural Geometry & Data Generation
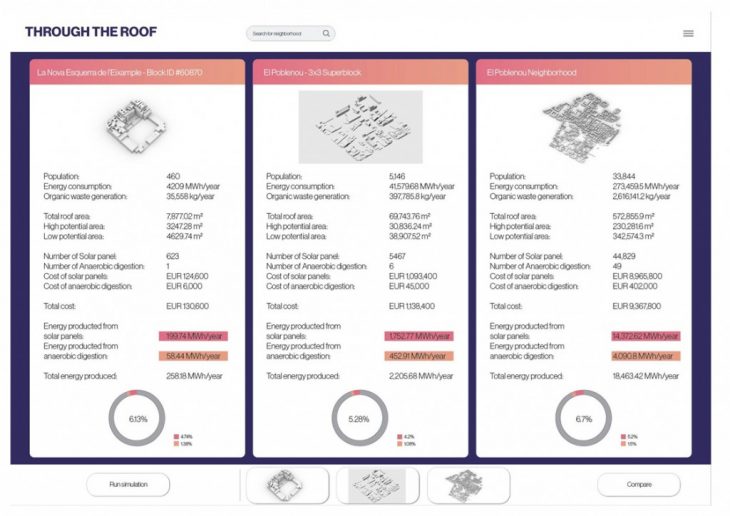
In addition to the calculation, Through the Roof tool allows conducting a comparison analysis among the generated calculations, where they are simultaneously exported at the end of each simulation execution. This interface allows to compare the results side by side and visualize the most efficient block, neighborhood,…
Demonstration
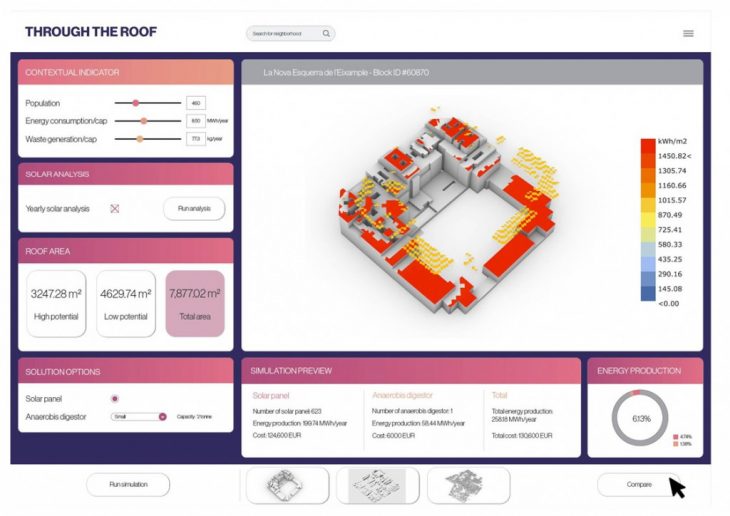
Through the Roof allows you to search for the neighborhood you want to analyze in the city of Barcelona in the search menu. A 3D model will be uploaded in the visualization screen in which the user can decide to open all the maps or select just a few blocks. One block can be simulated as well. One the model is opened, three main data characteristics of the chosen area are displayed from the data of 2020: the number of population, energy consumption per capita per year and organic waste generation per capita per year. These numbers can be used as-is or changed manually.
Another panel allows the users to conduct the solar potential analysis on the roofs, which displays the yearly potential. When the analysis is conducted, the below panel displays the high potential areas in meter squared as well as the low potential areas and the total. These parameters have been set in the script based on which areas are best for solar panel placements. Users can choose to view these areas separately by clicking on the button.
In the solution panel, the two solutions studied in this tool are displayed: solar panels and anaerobic digestion plant which comes in two scales to be selected from the window. Once the choice of solutions is selected (both or only one), the tool is ready to simulate. The visualizing screen displays the image of the solar panel placements on an exploited layer. Below the visual results are the numbers that can be looked at such as the number of solar panels or anaerobic digestion, their collective energy production and the total cost. A total of both is displayed next to it as well as a pie chart to visualize how much of the energy consumption is being covered by these solutions.
The user can make more adjustments in the previously described panels, and re-run the simulation. Once it is over, the conducted analysis can be saved or exported for comparison. The same process can be done with several blocks or an entire neighborhood.
The other aspect of this tool can allow the users to compare all conducted simulations in order to visually display the case studies next to each other to compare the charts and the numeric results.
Future Development
As many researchers and designers work and propose solutions for self-sufficient and circular neighborhoods and cities, there will always be room for improvement and adjustment in such simulation and calculator tools.
For instance, solar panels and anaerobic digestions are not the only solutions to produce energy and recycle the waste within our living space. Studying and listing other solutions to study their processes, performances, resources needed and the data can be a step to further advance and complete this tool.
Many researches have demonstrated that analyzing a specific case study helps in ‘‘customizing’’ the solutions better and obtaining optimum results. This gives another hint in how to improve the datasets, scripts, and calculations behind the tool to get more accurate results. For example, knowing the exact energy consumption of a specific building or city block instead of applying the generic number of the energy consumption of the city as a whole is more accurate and precise.
Through the Roof is a project of IaaC, Institute for Advanced Architecture of Catalonia
developed at Master in City & Technology in (2019/2020) by:
Students: Sarine Bekarian, Mahsa Nikoufar
Faculty: Eugenio Bettucchi, Rodrigo Aguirre
Faculty Assistant: Alex Mademochoritis, Iacopo Neri