Introduction
One of the main goals of Master in City and Technology is to learn to use data in urban analysis. Throughout the whole program several methods have been introduced to us like methods on cleaning, understanding, plotting, animating and finally visualizing data, in order to justify and inform our design decisions. And of course, one of the most important aspect of data analysis and data visualization is the conclusions. Besides having the knowledge and the tools to analyze them, we should always be aware of what data is trying to say to us.
Throughout the 3 terms of the program, we were following the class of Digital Tools and Big Data that is introducing us to all these methods of data analysis and visualization, as well as drawing conclusions. For our last project, we decided to elaborate our research and analysis more on the subject that we are dealing with in our studio project: Urban Vibrancy.
Urban Vibrancy
Urban Vibrancy is the study associated with activity intensity, the diversity of land-use configurations, and the accessibility of a place. During our 3rd term our main research focus was to define Urban Vibrancy, find ways to accurately measure it and inform our design decisions from the conclusions.
The dataset
One of the indicators of Urban Vibrancy is the presence and the movement of people in a place. Our focus area is Sant Marti, one district of Barcelona, where the 22@ program is implemented. For this reason, the area contains activities of all kinds, from leisure to work to residency related. In order to understand the movement of people in the area we used GPS related data from November of 2019. There are entries for 7 whole days, from Monday, the 18th of November to Sunday the 24th of November in the dataset.
The first intention was to understand how many people move in the study area. We visualized the number of people moving every day from 00:00 to 23:40. Time is separated every 10 minutes.
Peoples’ movement in Sant Marti during the week of 18th to 24th November 2019 | source: GPS related data | access to full videos:
In addition, we wanted to understand better when this movement occurred. Below, it is shown how many people moved during the day (06:00 – 18:00) and night(18:00 – 06:00), for the 7 days of the week.
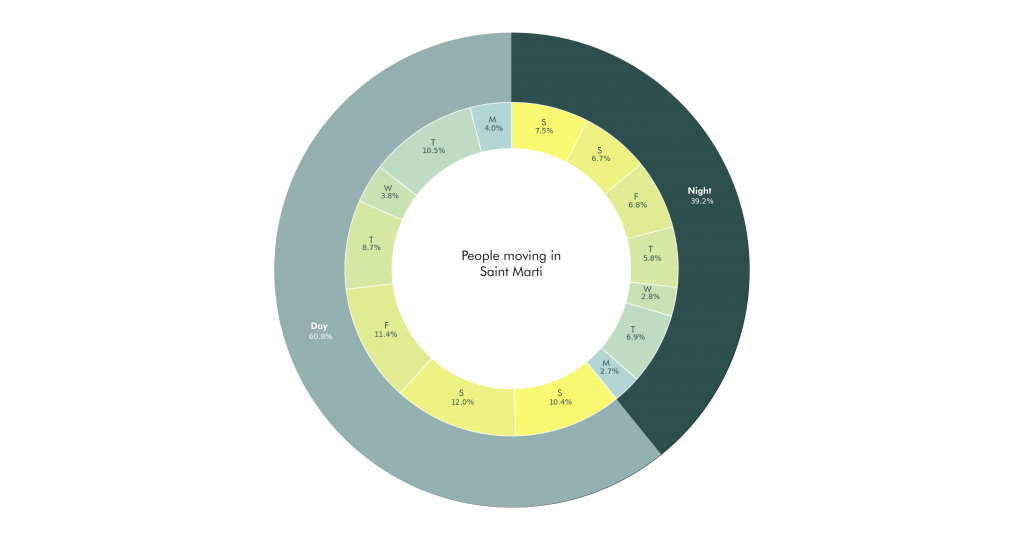
From the diagram we can understand that people move more during Friday and the weekend, both at day and at night. The biggest percentage of people moving in the area was on Saturday during the day.
Finally, in order to understand the places where people move more, moving pandas1has been used to identify specific trajectories and flows in the study area.
(disclaimer: For better visualization, we used a dataset of 10 Ids. )
Mapping the stops
Urban Vibrancy is not only about the presence of people but most importantly about the activity of people. Besides the good urban form, a place can be vibrant based on the mixture of activities that it contains.
Through the dataset we analyzed we could also identify the stops of people, and based on time we could categorize them on the reason behind the stop. Since our studio, in terms of people, focuses more on the urban vibrancy of the ground level we decided to filter the stops that are from 1 to 3h maximum. Most probably a stop of 1 to 3 hours identifies access to services, amenities or leisure.
On the same way as before, we also needed to understand where people stop. In the map below we can see where people tend to stop more for 1 to 3h. Based on our analysis, we can conclude that the most visited places are:
–During the weekend : Jardins de Josep Trueta, the center of Rambla del PobleNou, near Llacuna metro station and near Glories.
–During the week days: Jardins de Josep Trueta, the center of Rambla del PobleNou, Glories, Gran Via de les Corts Catalanes and the Industrial Park. However, in the map of the weekdays we can see that the concentration of people is more distributed, and in many cases it is around offices, nursery schools, sports centers etc.
People stops for 1 to 3h during the week | source: GPS related data, OSM
Where people stop for 1 to 3h during the week | source: GPS related data, OSM
Finally, we wanted to see why people stop at these places. In order to do that we wanted to check how close these places are to services and amenities or open spaces. To do so, we mapped the total heatmap of people stops in Sant Marti comparing it to the amenities that the area offers. As we can see, most of the amenities are near a small or big cluster of stops of people. In this way, we can conclude that our hypothesis on 1 to 3h can be validated from our analysis.
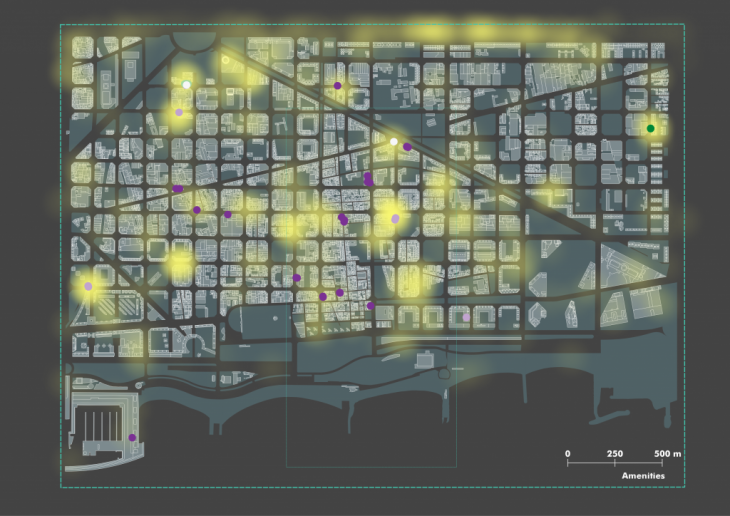
Leisure spots with amenities | source: OSM, GPS related data
Conclusions
After our analysis, we can understand the vibe of the people in Sant Marti, for the specific dates. The flows and the stops actually give us a pretty whole picture on the how and the why of movement of people. As a next step on this project, we would like to expand our analysis for other days, even comparing it with data during and after the pandemic, to understand how this affected the flows of the people. Besides that, the conclusions we reached will be beneficiary for our studio project as well, where we develop metrics to measure efficiently Urban Vibrancy.
Lastly, we believe that the most important conclusion from this class is that working with data can really help the part of designing and decision making. The tools we were introduced through the year are an important knowledge for data analysis and visualization.
The Vibe of the City is a project of IAAC, Institute of Advanced Architecture of Catalonia developed at Master in City and Technology in 2020/21 by students: Arina Novikova, Kshama Patil, Simone Grasso, Sinay Coskun and Stephania Maria Kousoula and faculty: Diego Pajarito
References
-
https://anitagraser.github.io/movingpandas/
ps.
The other projects we worked on Urban Vibrancy and benefited from similar data analysis and visualizations could be found here:
Urban Panopticons | Urban Vibes:
Internet of Buildings | Phoenix PobleNou: