The eye is a single web platform which helps the urban designer and decision maker to simulate and predict the impact of different urban planning scenarios. This platform uses real-time data through the computer algorithm and machine learning in order to transform the raw data to the knowledge about cities dynamic state. Furthermore, the project opens up a new workflow for urban planning by providing a range of concussion that proposals will cause. This insight could help the designer in the next generation of their design.
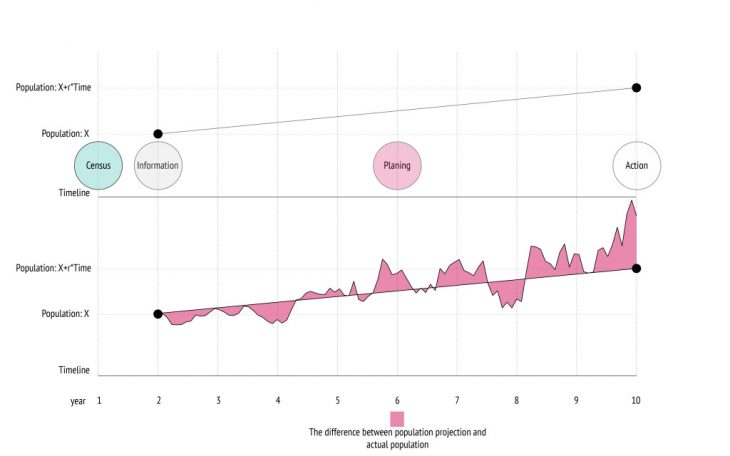
Today the urban planning is based on the assumption and speculation from uncertain data through the subjective process.
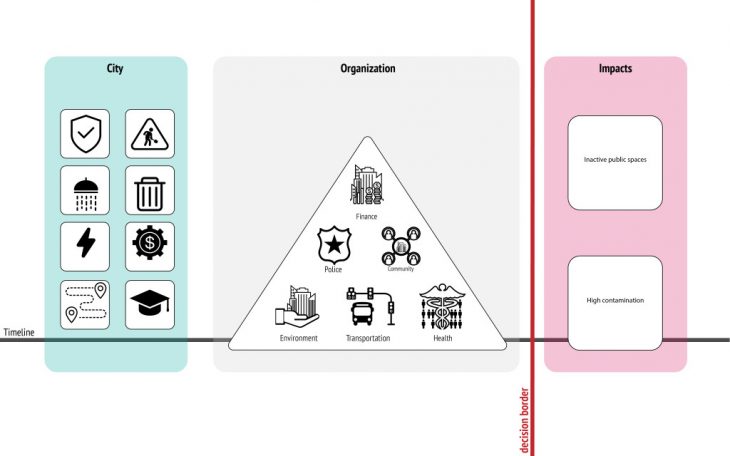
As mentioned in the video. In the urban environment, we are facing a complex dynamic system which is growing rapidly. and a series of demands are compelled. To address the requirement of this system we divided the organization between different stakeholders. Also it worth to mention that because we living in a consumer based society most of the decisions are in favor of the financial benefit.
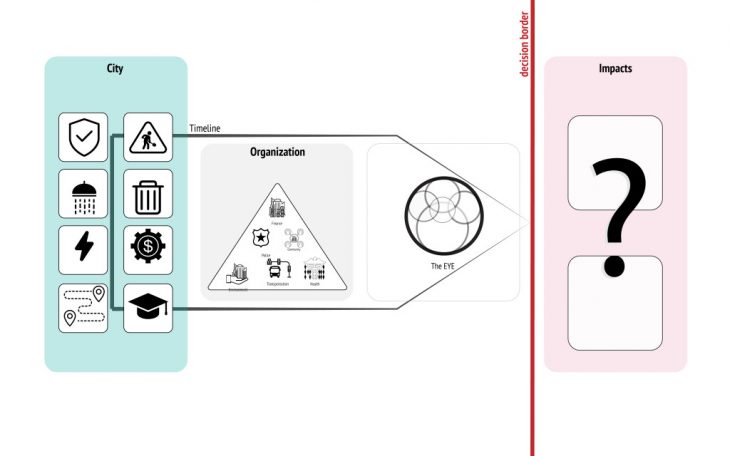
This dissertation tends to use the real-time data through the processes of a computer algorithm and machine learning to be able to create a single platform within users (will be defined in later) can access to and process the data. Moreover, they can simulate and predict the impact of urban planning.
the stakeholders who are involved in the city organization can simulate their proposals. By this, they can have an insight into the impact that their decision may cause. The platform is also a way of communication between different stakeholder for a coherent workflow in the city management system.
To clear out certain terminologies that may intercept your understanding in the following section.
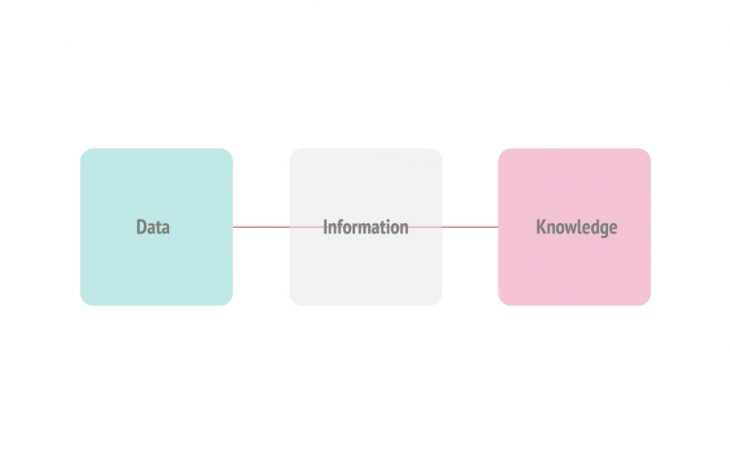
Data: is the smallest quantity of information
Information: is Data within the interconnections and correlations.
Knowledge: is the product of the cognitive on the information.
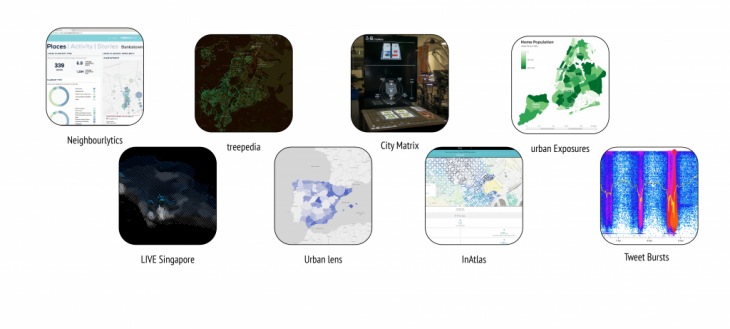
There are many projects in the discipline of Urban designing that try to investigate digital data as a source of information. The mainstream of this project is data visualization to convey a relation between data and geolocation.
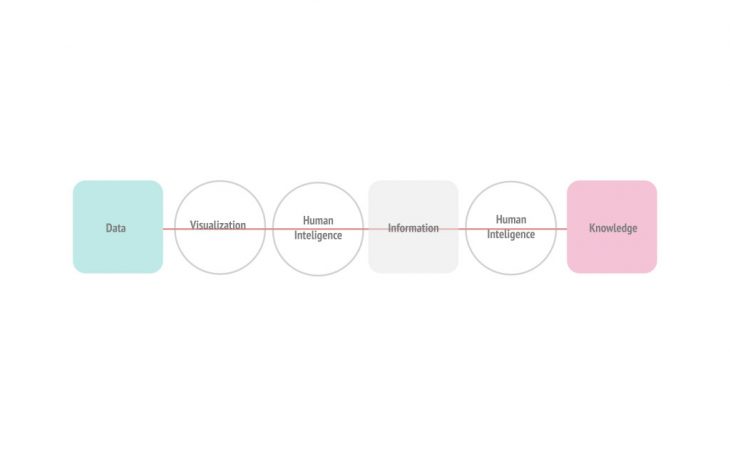
This is the flow of the data model in the current state of the art.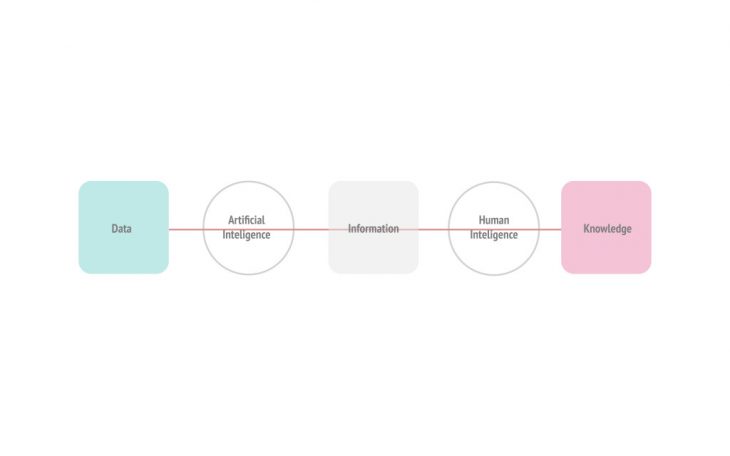
As mentioned earlier by the digital revolution we have access to a vast amount of data from different sources and their updating in each second. This almost impossible for humans to process and react to this amount of information in real-time. What has been proposed is an automation process white the help of artificial intelligence in the way to find out the connection between each bit of data.
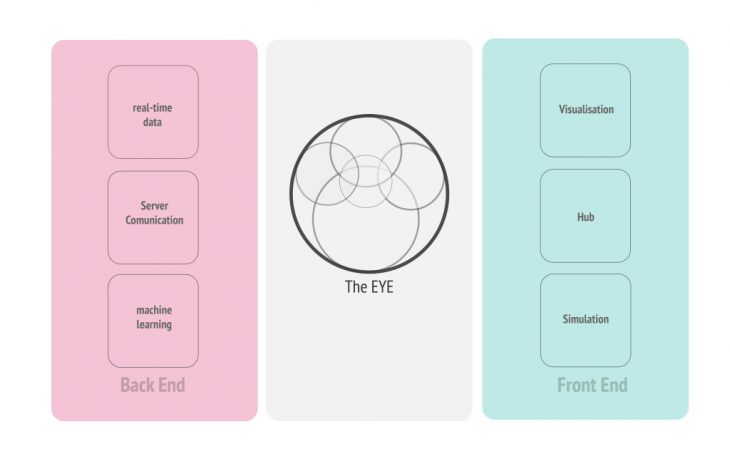
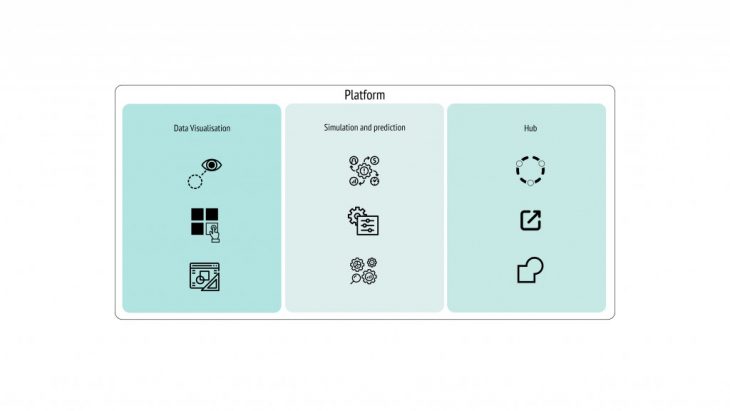
Web platform: easy accessibility.
Data visualization:
1-perceive easier with our sight.
2-clear distinguishing
3- simple interacting
simulation:
1-see the impact of certain planning
2- Understand the influence of different parameter
3-Evaluate each decision or planning
Hub:
1-to be communicate
2-to share
3-to be collective

This diagram demonstrates how the data flow happening in the platform.
In order to test this proposal, an experiment was designed. For this experiment will focus on mobility data in particular. Since mobility is the most requested type of data. Also, It is changing rapidly, thus it could be a good representative of cities dynamic behavior. For the context of the experiment, Manhattan is chosen for two reasons. First because of easy accessibility to data. On the other side because of high interest in terms of complexity.
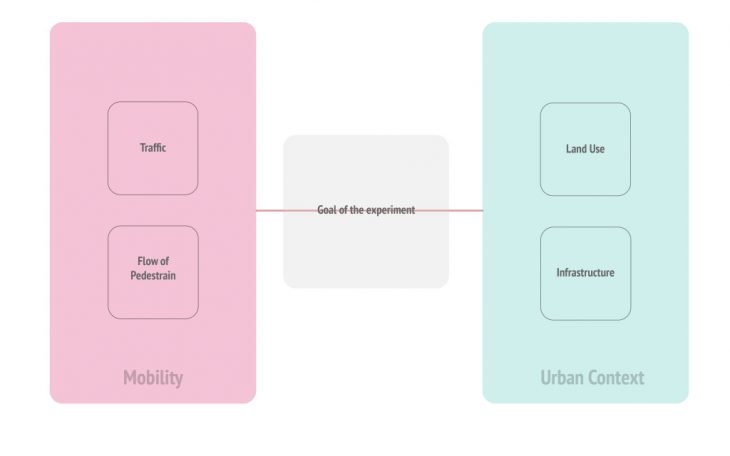
The goal of the experiment is to find the relation between traffic and flow of the people in the context of the urban environment with the help of machine learning algorithm.
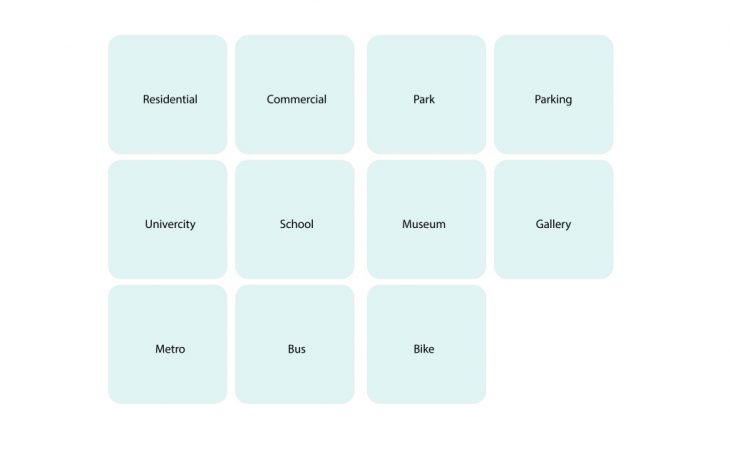
These are the land use and infrastructure that has been considered in the experimentation.
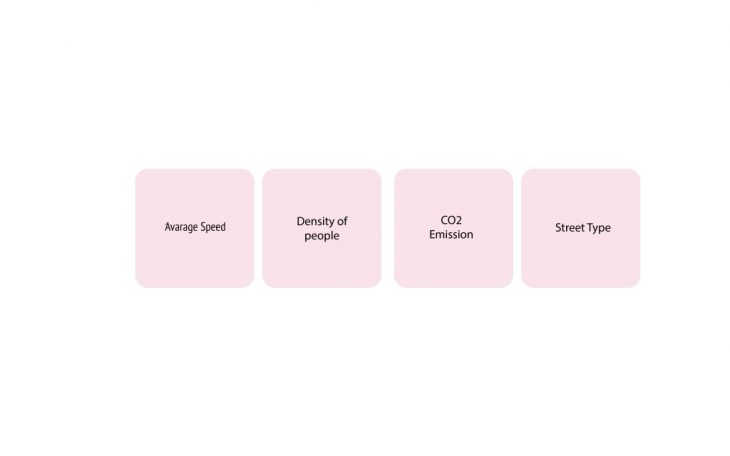
And this is the mobility parameter that has been looked.
In this experiment, data has been modeled in the four following way.
Grid intersection
Random points
Raster image
Street Buffering
For the objective of this experiment, the street buffer model worked quite well. Because of the restriction on traffic data the experiment being held on traffic simulation data, However, the algorithm reached an acceptable level of prediction.
Bibliography
Gandomi, A. and Haider, M. (2015) ‘Beyond the hype: Big data concepts, methods, and analytics’, International Journal of Information Management. Elsevier Ltd, 35(2), pp. 137–144. doi: 10.1016/j.ijinfomgt.2014.10.007.
Habtie, A. B., Abraham, A. and Midekso, D. (2017) ‘Computational Intelligence in Wireless Sensor Networks’, 676. doi: 10.1007/978-3-319-47715-2.
Jiang, S. et al. (2016) ‘The TimeGeo modeling framework for urban motility without travel surveys’, Proceedings of the National Academy of Sciences, 113(37), pp. E5370–E5378. doi: 10.1073/pnas.1524261113.
Lin, Z. et al. (2017) ‘Deep Generative Models of Urban Mobility’, ACM SIGKDD Conference, Halifax, Nova Scotia, Canada, August 13-17, (17). doi: 10.475/123.
Liu, Z. et al. (2018) ‘Urban Traffic Prediction from Mobility Data Using Deep Learning’, IEEE Network, 32(4), pp. 40–46. doi: 10.1109/MNET.2018.1700411.
Papathanasopoulou, V., Antoniou, C. and Koutsopoulos, H. N. (2018) Data-Driven Traffic Simulation Models, Mobility Patterns, Big Data and Transport Analytics. Elsevier Inc. doi: 10.1016/b978-0-12-812970-8.00011-7.
Shafizadeh-Moghadam, H., Tayyebi, A. and Helbich, M. (2017) ‘Transition index maps for urban growth simulation: application of artificial neural networks, weight of evidence and fuzzy multi-criteria evaluation’, Environmental Monitoring and Assessment. Environmental Monitoring and Assessment, 189(6). doi: 10.1007/s10661-017-5986-3.
Song, X., Hiroshi, K. and Ryosuke, S. (2016) ‘DeepTransport: Prediction and simulation of human mobility and transportation mode at a citywide level’, IJCAI International Joint Conference on Artificial Intelligence, 2016–Janua, pp. 2618–2624.
Triantakonstantis, D. and Stathakis, D. (2015) ‘Urban Growth Prediction in Athens , Greece , Using Artificial Neural Networks’, International Journal of Civil, Environmental, Structural, Construction and Architectural Engineering, 9(3), pp. 217–221.
Xia, F. et al. (2018) ‘Modeling and Analysis of Large-Scale Urban Mobility for Green Transportation’, IEEE Transactions on Industrial Informatics, 14(4), pp. 1469–1481. doi: 10.1109/TII.2017.2785383.
Zehe, D. et al. (2015) ‘SEMSim Cloud Service: Large-scale urban systems simulation in the cloud’, Simulation Modelling Practice and Theory. Elsevier B.V., 58, pp. 157–171. doi: 10.1016/j.simpat.2015.05.005.
Zeng, W. et al. (2013) ‘Visualizing Interchange Patterns in Massive Movement Data’, 32(3). doi: 10.1111/cgf.12114.
Zhang, J. and El Kamel, A. (2018) ‘Virtual traffic simulation with neural network learned mobility model’, Advances in Engineering Software. Elsevier Ltd, 115, pp. 103–111. doi: 10.1016/j.advengsoft.2017.09.002.
Zhong, C. et al. (2014) ‘Computers , Environment and Urban Systems Inferring building functions from a probabilistic model using public transportation data’, Computers, Environment and Urban Systems. Elsevier Ltd, 48, pp. 124–137. doi: 10.1016/j.compenvurbsys.2014.07.004.