TERRITORIAL INDEXING
MAPPING KNOWLEDGE IN ANTARCTICA
Nature of Cities
Cities are, in large part, shaped by the nature of work. More specifically, the technological advancements that accompanied these work have always defined the settlements of particular Eras. The first civilizations were a product of the shift from nomadic tribes to towns – brought about by the invention of agriculture. The steam engine bridged the gap between cities, which led man to overcome the physical limitations of the human body.
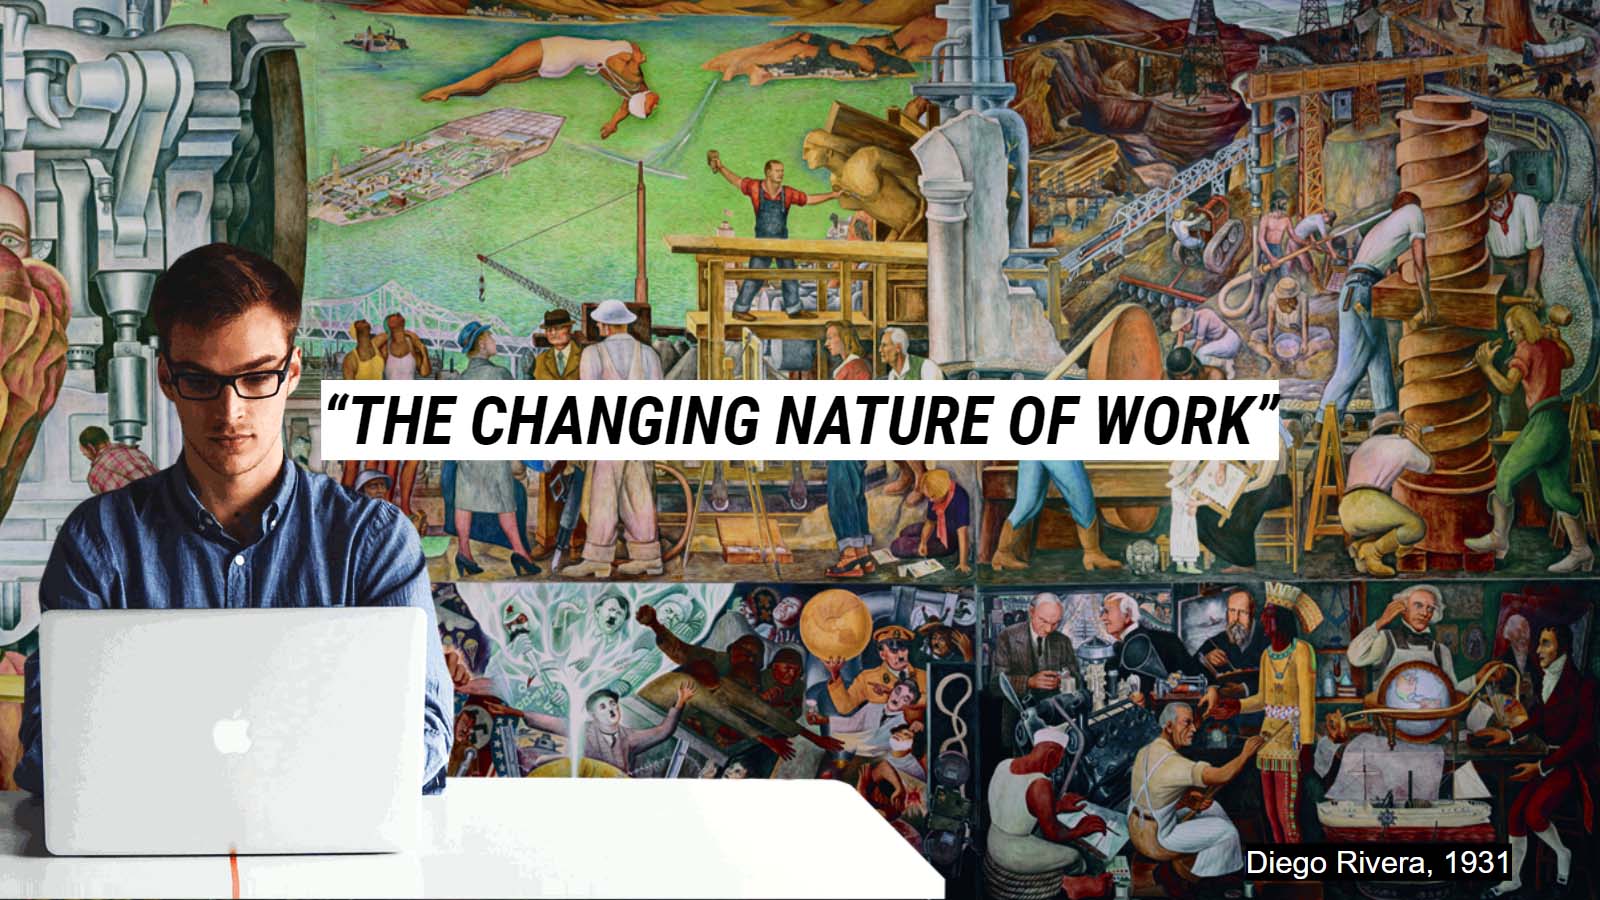
The changing nature of cities is largely influenced by the nature of work
For the past recent decades, it has been the information technology revolution that greatly influenced social structures, working environments, and consumption patterns. None is more defining than the internet as it bridged the gap between countries and created an ever more connected world. Continuing still are technological advancements in Artificial Intelligence and machine learning, which persists to help man overcome the boundaries of the human mind. With these advancements, data and information are becoming more valuable commodities than ever before. Knowledge-based services continue to grow as a significant portion of the global economy in this era of information-hunger.
Knowledge-Economy
Mental input and innovation are what matters. – Mike Weaver
In a knowledge economy, the system of consumption and production is based heavily on human and intellectual capital. Proper accumulation of knowledge and creative skills is one of the attributes of some of the most thriving cities. One striking feature of a knowledge-based market, however, is that it tends to concentrate success within certain dispositions. There will be no stopping the continuous acceleration of innovation; however, developing countries will need to take huge leaps in action to remain relevant. As it is, countries that have yet to catch up will struggle to reap the benefits of newer technologies. Ideally, we wish to democratize the knowledge economy. We strive to democratize the ability or efficiency of cities to produce knowledge for the hopes of urban prosperity.
The foremost consideration for knowledge generation is to have the enabling conditions for knowledge to thrive. Several factors can be identified as potential contributors. In most literature, these can be grouped under 4 of the pillars of the knowledge economy. Out of the several potential contributors, seven parameters were extracted as trial variables.
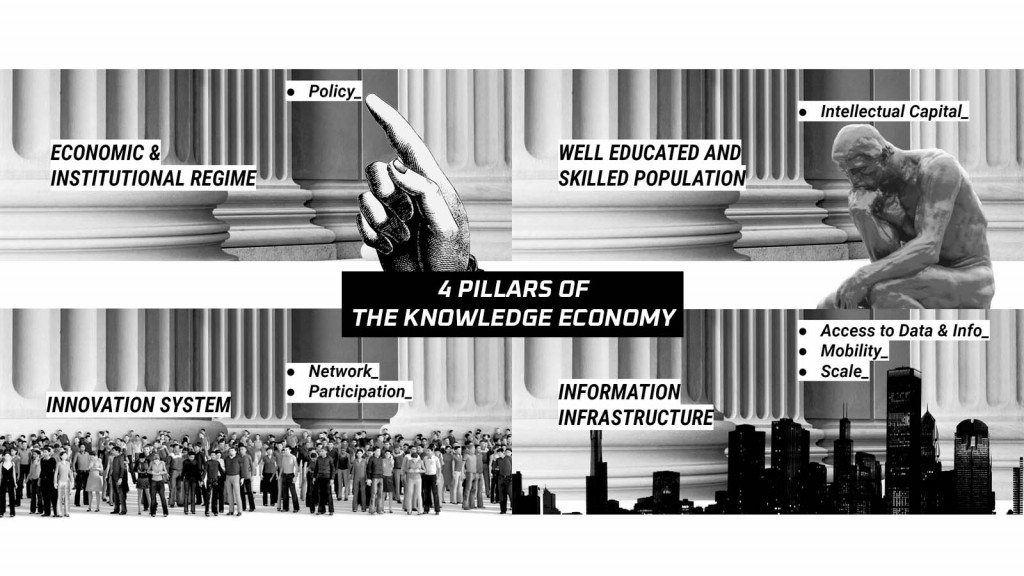
From the 4 Pillars of the “Knowledge Economy”, 7 parameters were extracted, namely: Policy, Intellectual Capital, Network, Participation, Access to Data & Information, Mobility, and Scale
These variables would be the keys to test the potential for economic growth to an area. Improvement of these factors is what enables the knowledge economy. As a data-driven economy, these variables also have the possibility to be quantified, compared, and assessed. What exactly is the lower threshold, and what is enough for a territory to be considered knowledge-based? And there is, in fact, a most interesting territory to test this out. There is a territory that is at both ends of the spectrum with an absolutely high intellectual capital and at the same time most extreme and restricted to network and access.
Antarctica
The highest, driest, coldest, windiest and brightest of the seven continents. Antarctica is one of the largest plots of land in the world and it dwarves most countries. Just imagine that it’s roughly the size of the United States and Mexico combined, and this mass of land is almost completely covered by a layer of ice that averages more than one mile in thickness.
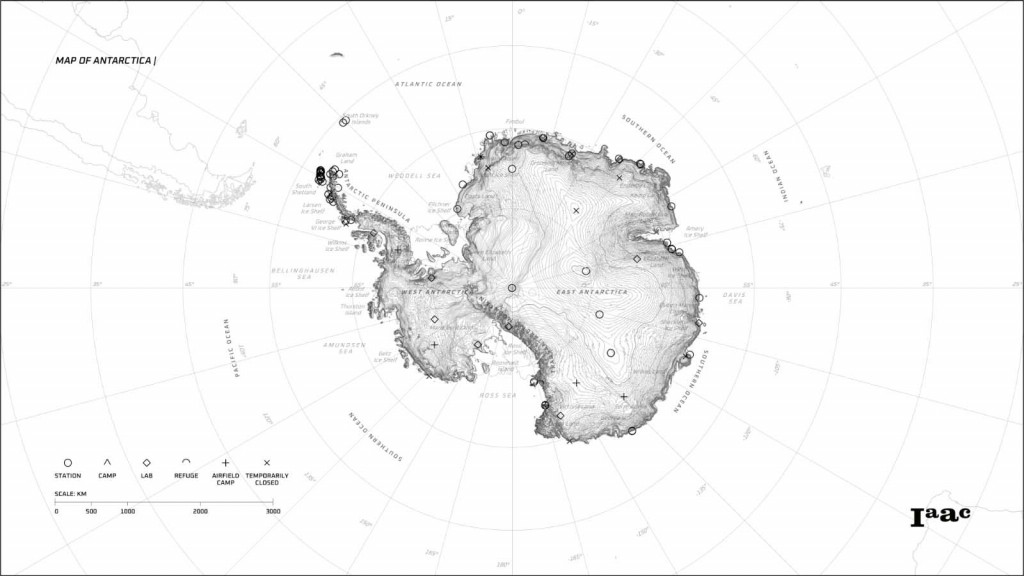
Map of Antarctica
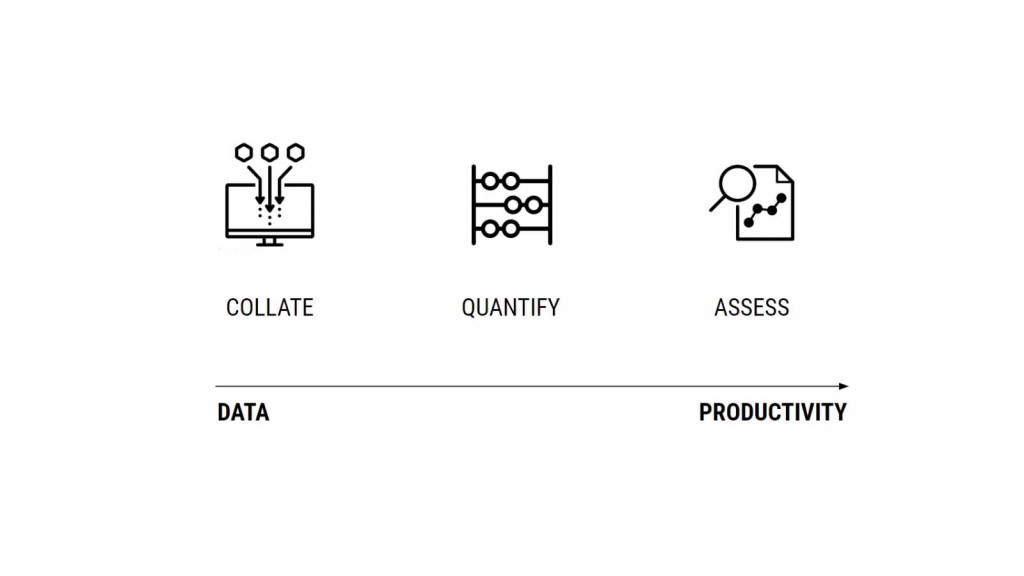
Moreover, the nature of work in Antarctica is perfect for the knowledge economy. Even the reason why people stay at Antarctica is primarily for the acquisition of knowledge and its consequent distribution. Existing information regarding the continent can be collated and quantified in order to assess its productivity.
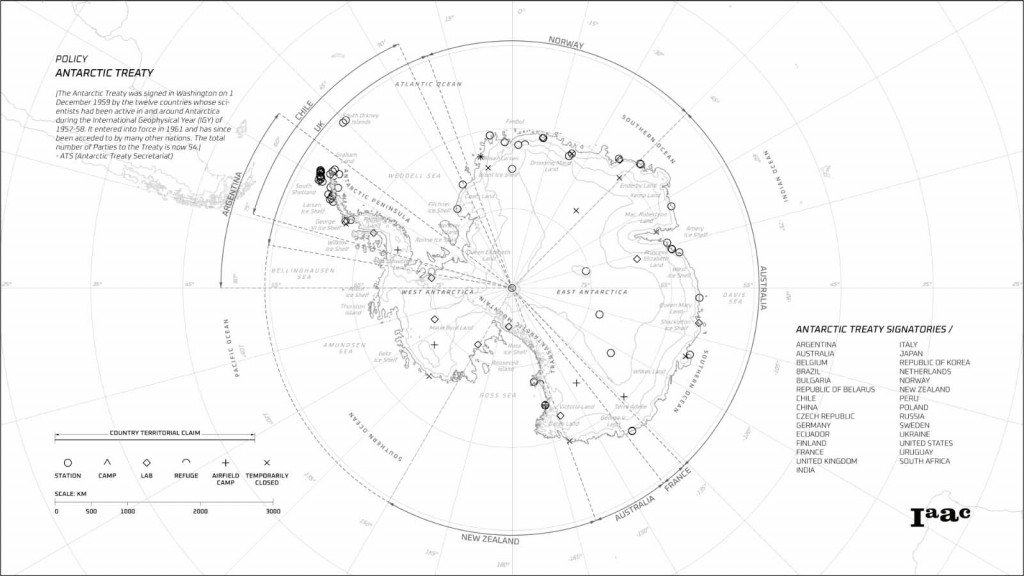
Policy: Antarctic Treaty
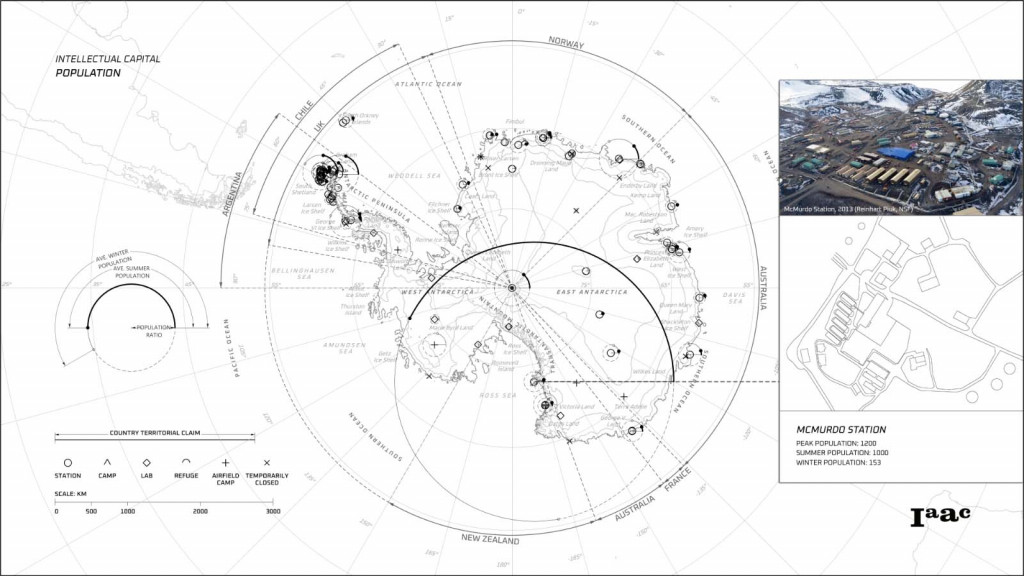
Intellectual Capital: Population
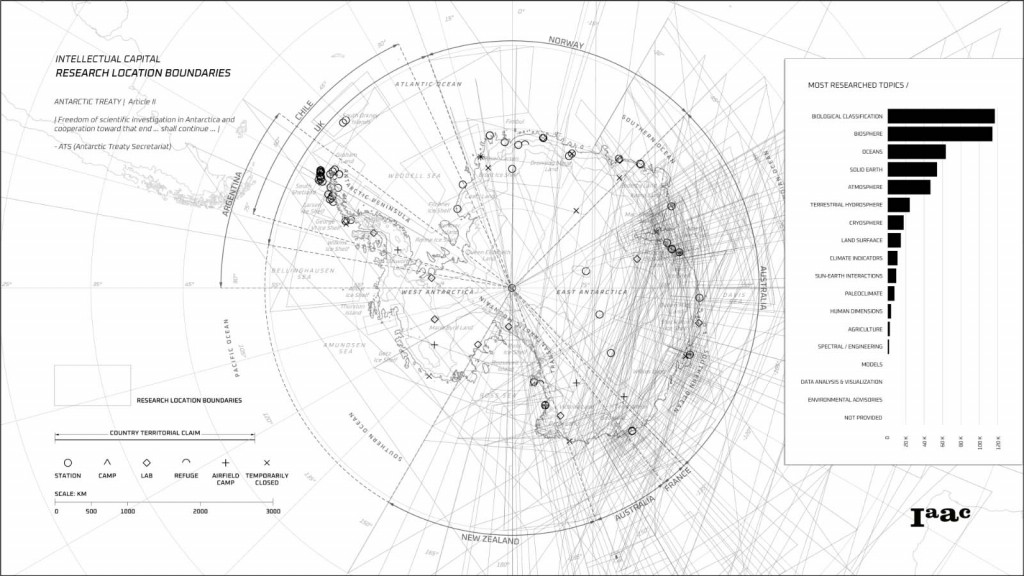
Intellectual Capital: Research Locations
Mobility: Available Transport Modes
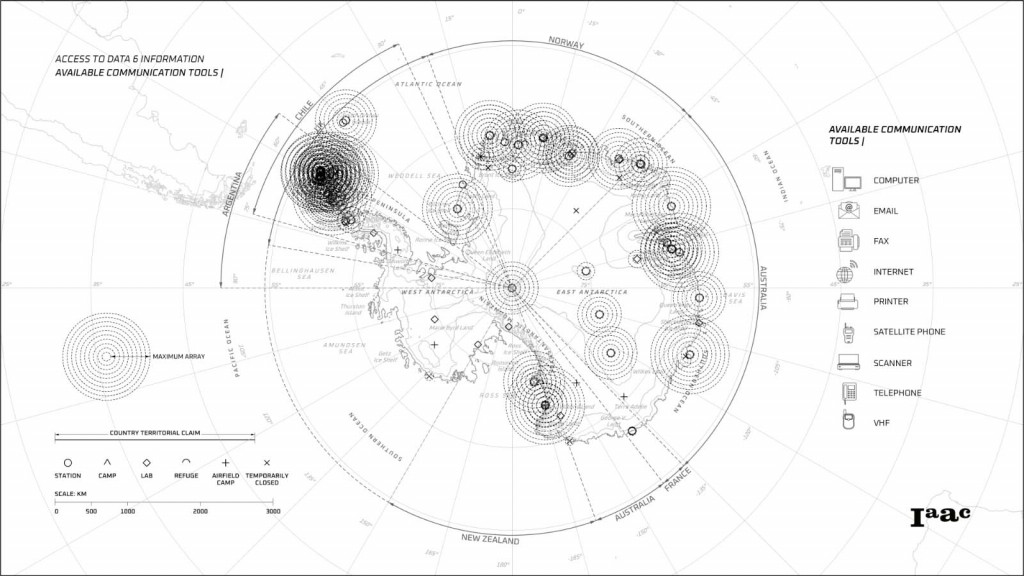
Access to Data & Information: Available Communication Tools
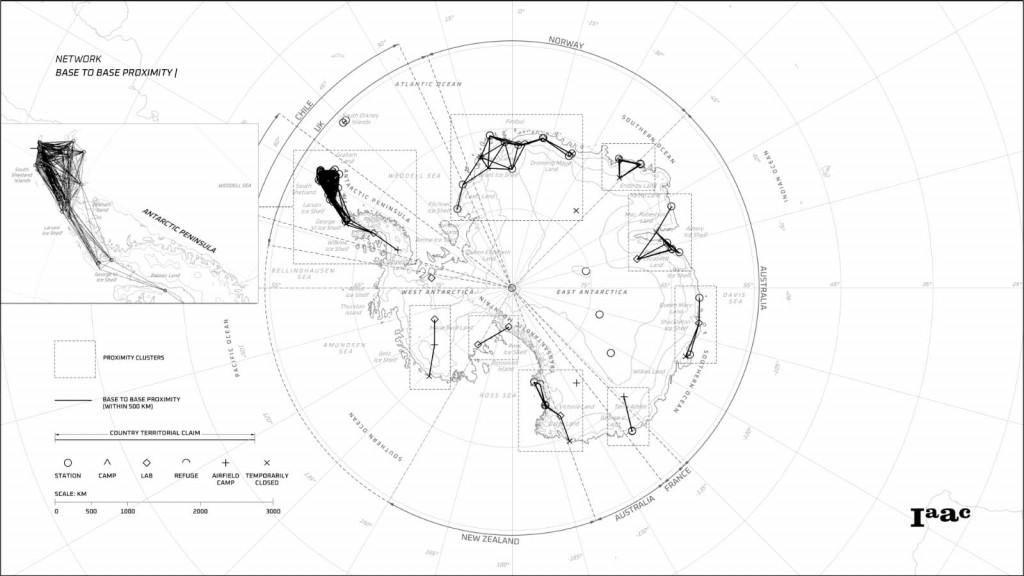
Network: Base to Base Proximity
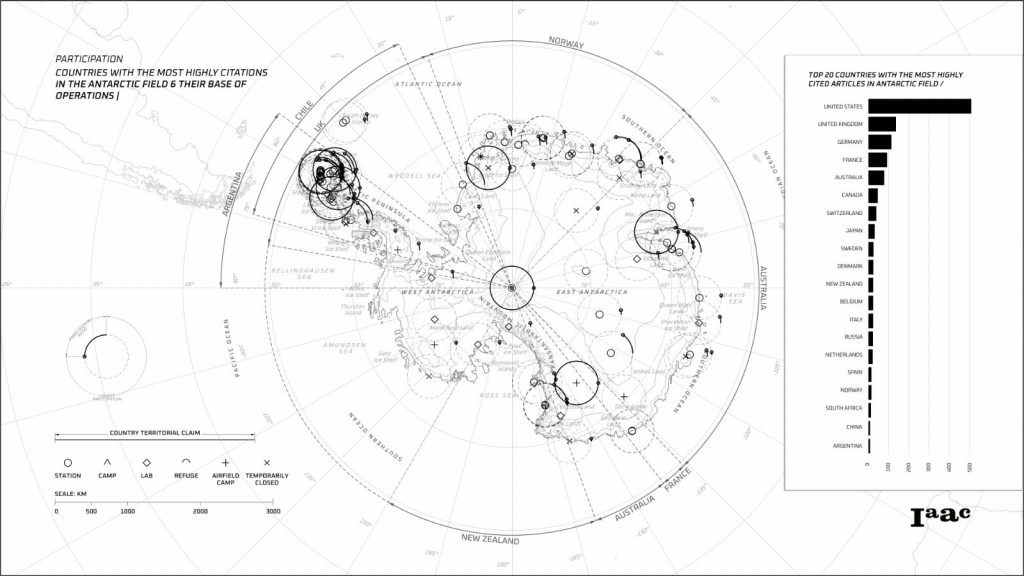
Participation: Countries with the Most Highly Citations in the Antarctic Field and their Base of Operations
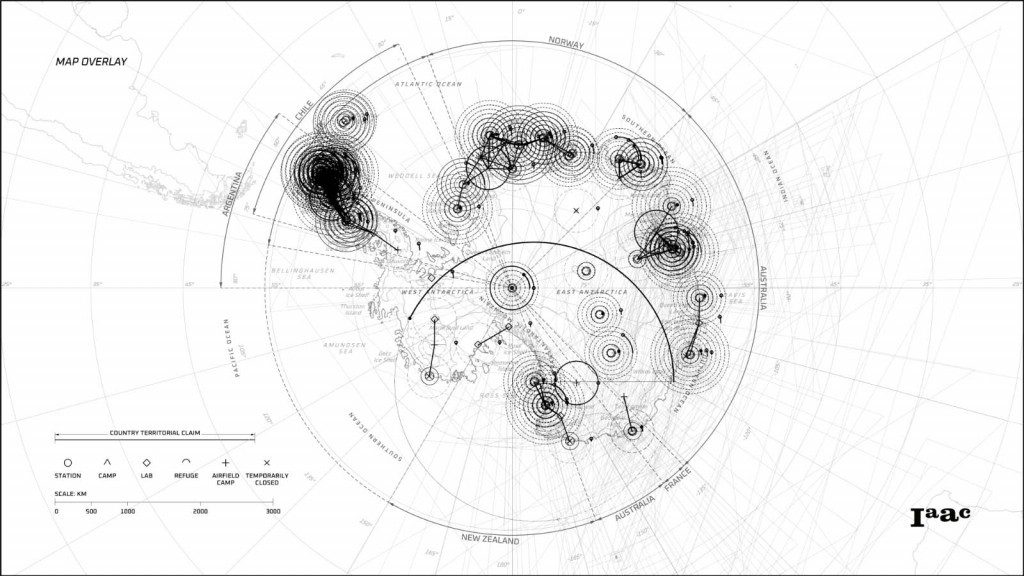
Map Overlay
Knowledge Index
Together, the overarching data has the ability to inform the planning of a territory. The need to quantify this data then follows. In order to make a coherent summary of all the laid out data, a location-based indexing system with hierarchal clustering is established. The index will serve as the container of all the information while also functioning as a mapping tool. The graphical tool used to serve both functions was the hexagon. Its geometric structure that is equidistant between neighboring cells makes it a good locational index. Furthermore, its perimeter/area ratio allows for a good approximation of contained information. In application to the territory, values gathered from all the areas were aggregated from minimum to maximum then remapped to a constant range of 1 to 10. A comparative index was then formed.
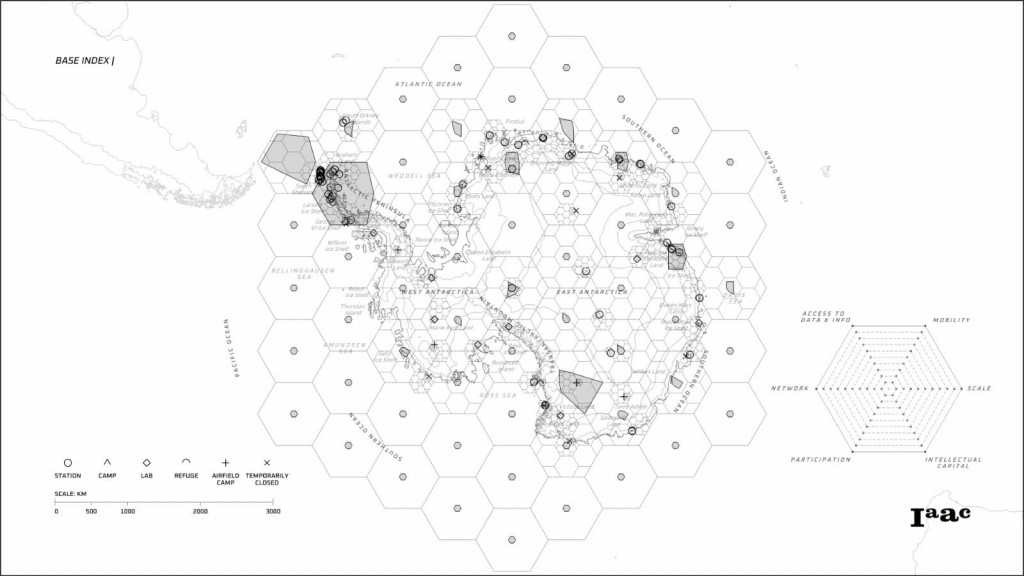
Antarctica Knowledge Index from Base Information
Each corner of the hexagonal container corresponds to a specific parameter. This results in a coherent metric that makes the assessment of strengths and potentials more rationalized. The base index shows the initial or standalone attributes of specific areas. Meanwhile, the spillover index collects the data from directly adjacent areas, remaps their values, and adds these values to the base index. The resulting representation of the spillover index shows how collaboration can possibly augment certain parameters of particular areas. It also shows how some parameters do not improve at all and as such, more viable to intervention or restructuring. Beyond the representation of data, the index can serve as a planning tool on the basis of productivity, collaboration, and efficiency.
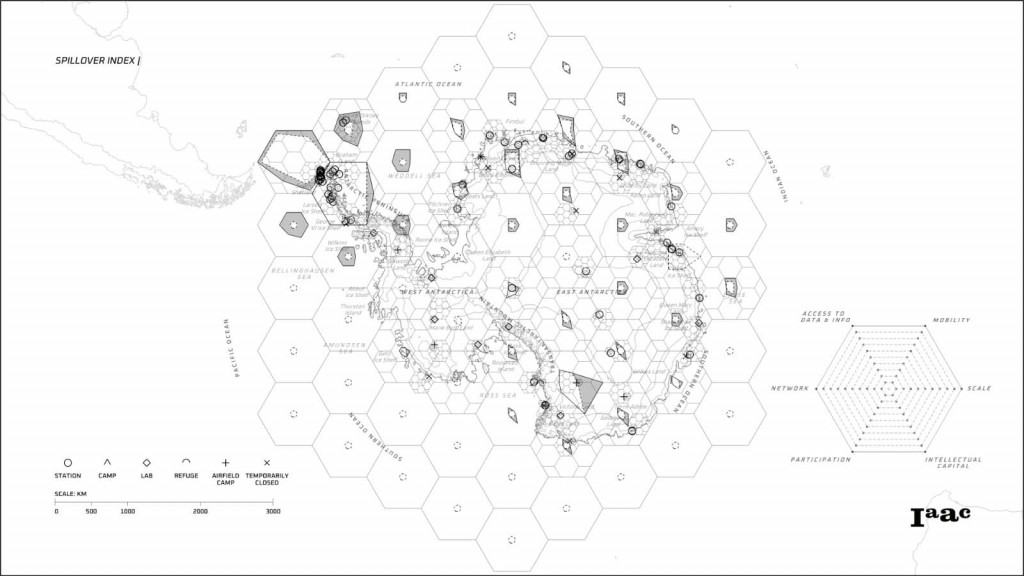
Antarctica Knowledge Index from Spillover Data
The hierarchical clustering also allows zooming in to regions of interest and smaller-scale analyses.
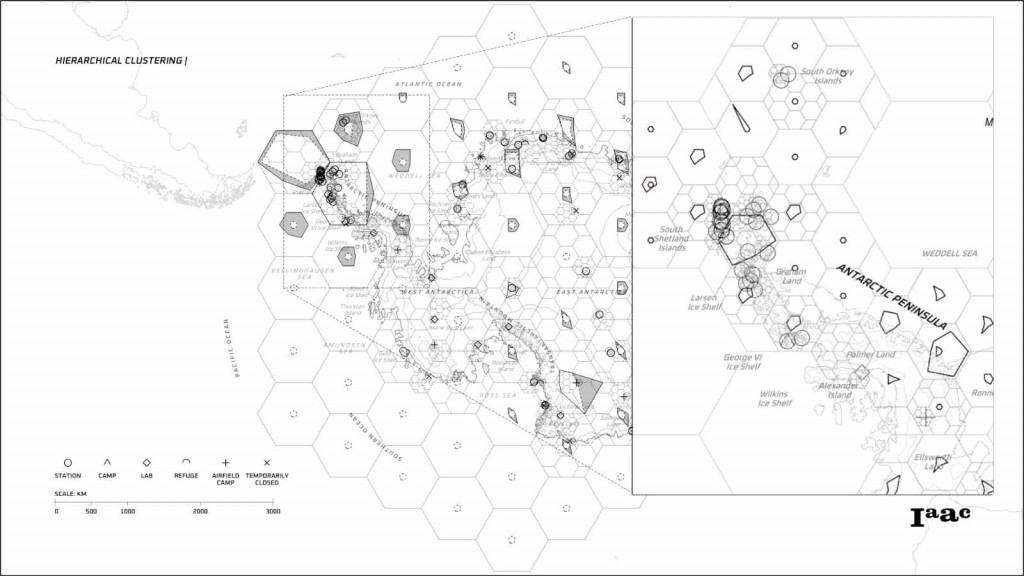
Hierarchical Clustering
Manila
Indeed, Antarctica is an extreme place where one should be well equipped in dealing with these conditions.
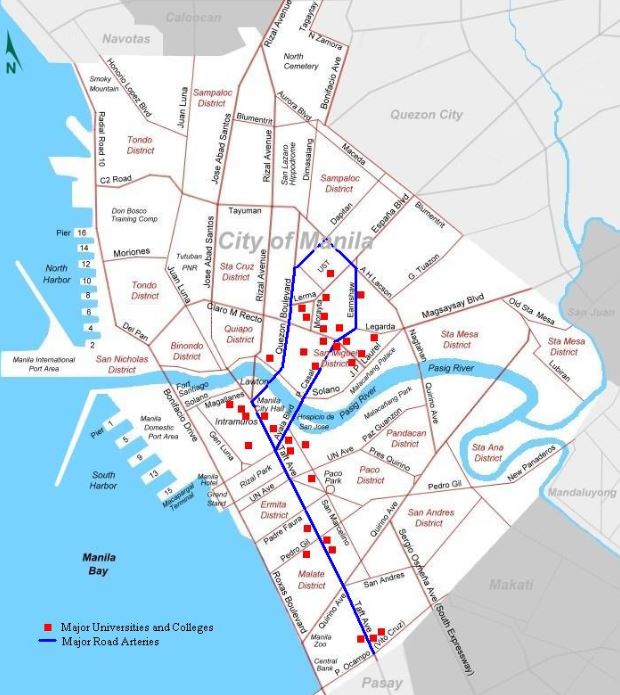
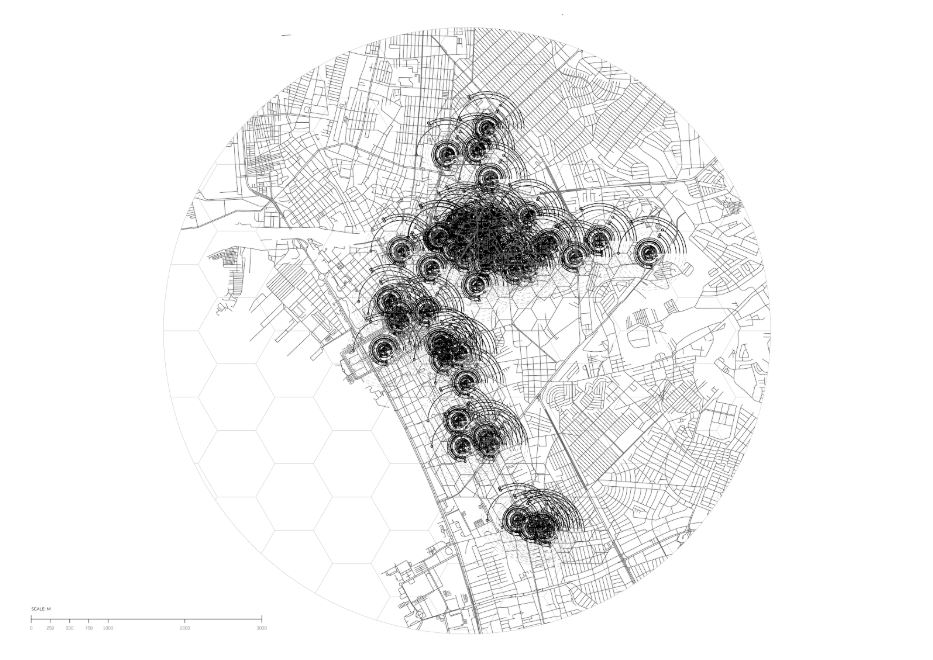
Using the same protocol in an urban context, the group chose Manila, Philippines, as a case study. Aside from being the capital of the Philippines, Manila is also known for being the grounds for major universities in the Metro, more known as the “University belt” or “U-belt” by the locals. It currently houses 48 institutions, 22 major ones. Four out of 22 belong to the top 10 universities according to the Quacquarelli Symonds (QS) Asia University Rankings.
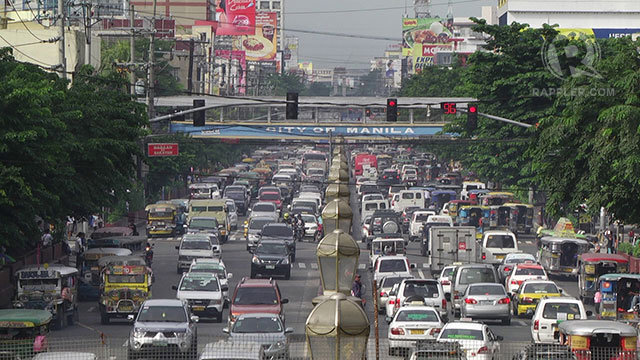
Like the frozen continent, Manila has its own fair share of extreme conditions. Things such as intense daily traffic which results in air pollution, high crime rate, and expensive accommodation are the things people should expect when deciding to live here. Despite all of these reasons, students across the country still dream of studying in one of these prestigious universities.
Applying the same protocol with universities as the center, the group were able to map out the best performing hexagons from the weak ones.

Majority of the prestigious universities are located along the main road of Manila. Thus, the intensity along this long stretch.
Scale in terms of student to staff ratio and intellectual capital in terms of number of publications each universities published.
The productivity of a student also depends on how engaged is the staff to him/her. If not given enough attention, the productivity remains at halt. Also, it directly affects the productivity of the whole institution. Alongside, the map shows the number of publications each universities have – an indicator of knowledge generation.
Together, one can conclude that these universities have adequate amount of student-staff ratio and are producing good amount of knowledge through articles.
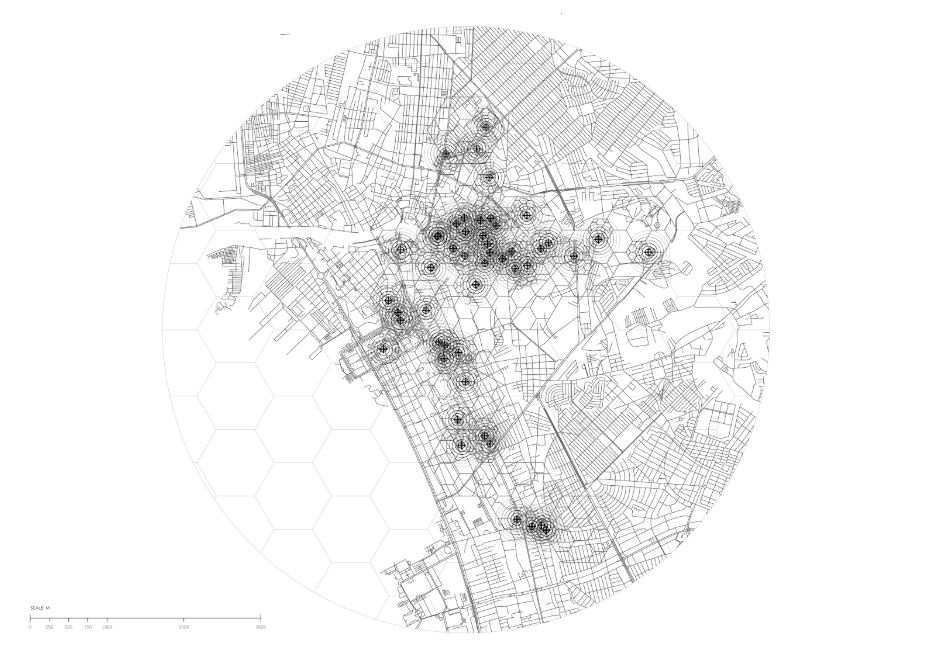
Mobility for these universities share the average score since they are located near the main thoroughfare.
For access to data and information, these 48 institutions share almost the same number basic communication facilities such as wifi, library, and computer room. In return, these enhance the productivity of each student and the knowledge transfer within and outside the university.
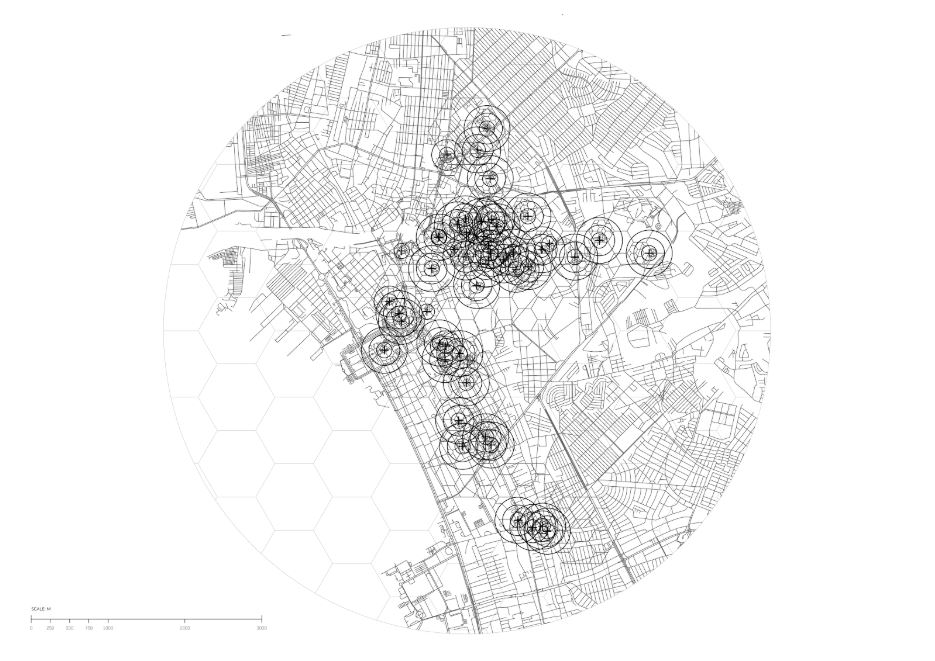
Networks of school are formed within a proximity of 500 meter distance. This means a student can visit one institution with approximately 700 steps. This densification also creates relationships and collaborations between universities. The largest group is concentrated at the heart of Manila.
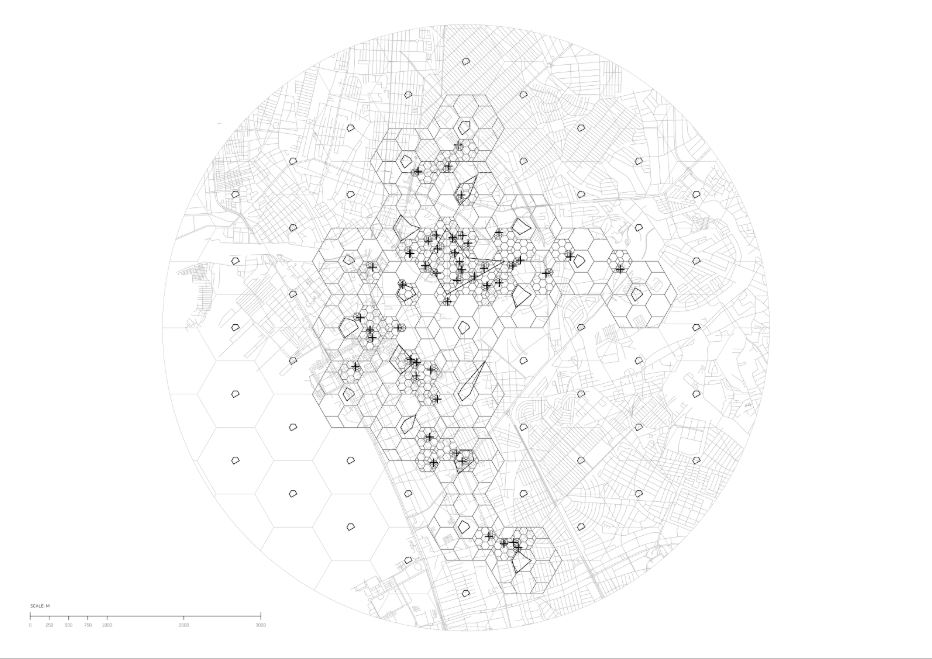
On the other hand, using the point index system, the result showed that only several hexagons got a high score. Neighboring hexagons do not benefit especially those afar.
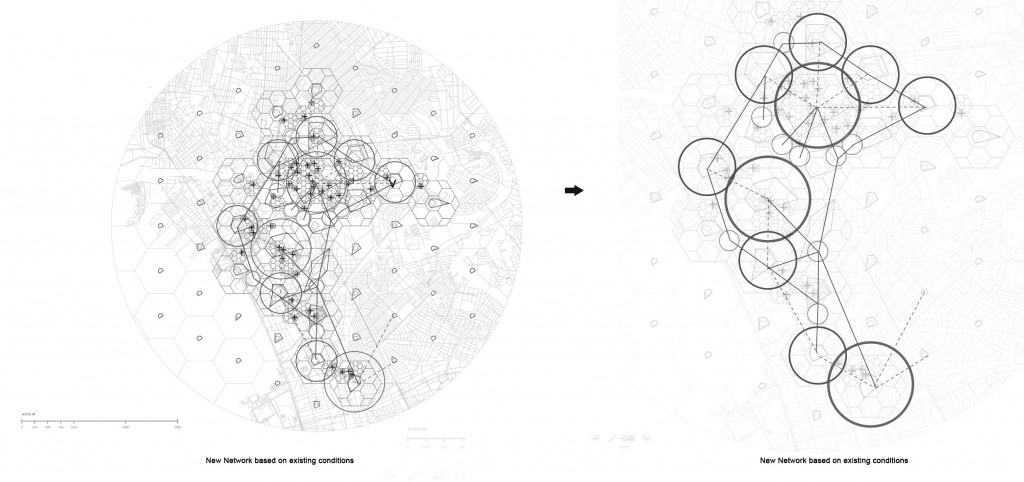
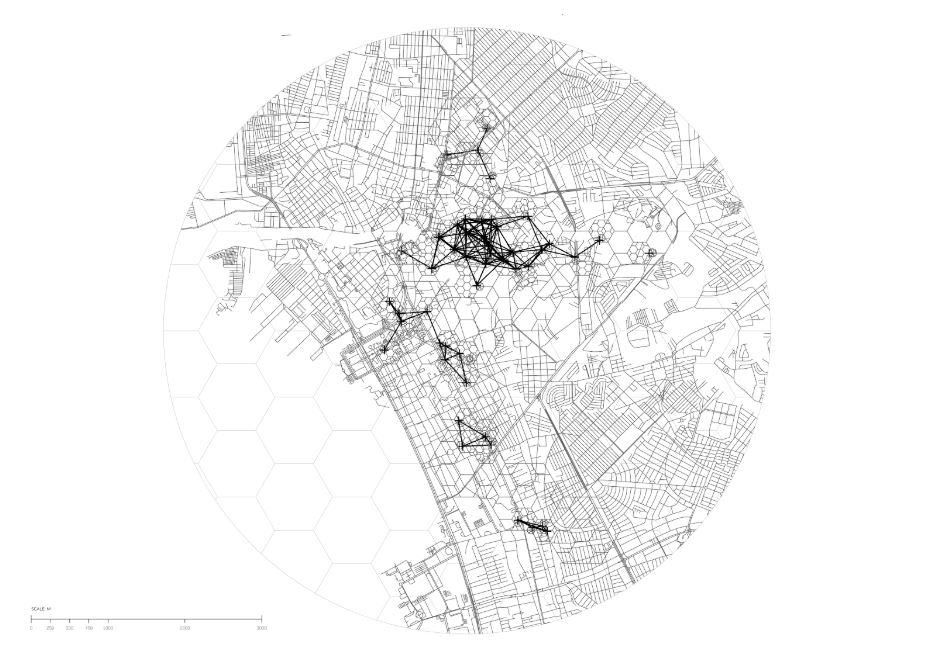
Looking at this map, what if we can create a new network, something that is missing in Manila using these universities as the central nodes of progress?
These existing universities will extend their power as a generator of collaboration to its neighboring areas. At the same time, these areas could be a new potential network, such as business companies, start ups, tech companies, etc. which are capable of knowledge transfer. Lastly, through clustering, other parameters will most likely improve and cause positive impact on its territorial scale.
Knowledge economy should have three factors: knowledge performance, generation and transfer. Without this, the whole concept will not work. With the constant change of nature of work, the knowledge economy becomes more important as it fosters growth, value and networks which are vital in today’s city.
Sources: Council of Managers of National Antarctic Program (COMNAP); Antarctic Treaty Secretariat (ATS); National Snow and Ice Data Center (NSIDC); National Aeronautics and Space Administration (NASA); The World Bank; Highly cited Antarctic articles using Science Citation Index Expanded: a bibliometric analysis (Hui-Zhen Fu1 & Yuh-Shan Ho, 2016)
Territorial Indexing: Mapping Knowledge in Antarctica is a project of IaaC, Institute for Advanced Architecture of Catalonia developed at Master in City & Technology in (2019/2020) by:
Students: Jianne Libunao, Rovianne Santiago, Lyle La Madrid
Faculties: Mathilde Marengo, Edouard Cabay