Stock in review explores the use of physical graph to display the stock market ups and downs of a number of companies.
It’s a way to physically create the bar graph for a certain time frame and let the users see it getting created. We have mapped the data of 6 companies namely, Apple, Microsoft, Google, Amazon and Facebook and the time-frame is 6 months.
The line graph displays the fluctuation of data of one company at once and then moves on to the other respective companies. The idea is simply to connect Arduino with several servo motors with gears, assembling them at the top of the plywood box and putting the thread through the gears in order to see the thread also move along with them to make this process happen.
Input – Stock market data
Output – Physical graph

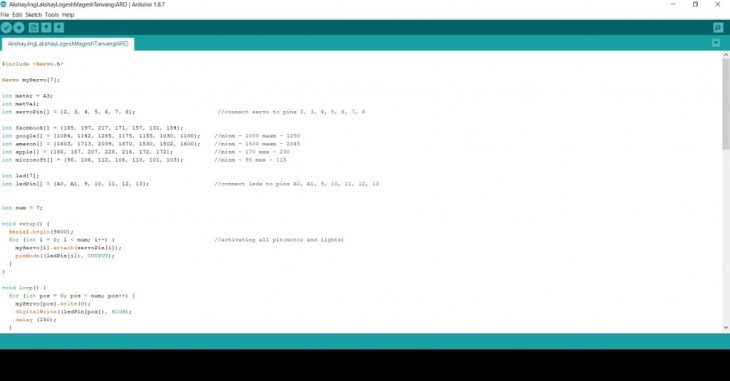
// physical graph showing stock market data

//mechanism showing the thread movement

//working of gears
// Concept

// Fabrication
4mm plywood box
4mm acrylic for gear system

// Mechanism
// Arduino
Pseudo code
1. Get data
2. List of motors
3. List of motor pins to be connected
4. List of LEDs
5. List of LED pins to be connected
6. Activate potentiometer pin as input
7. Activate led array pins and motor array pins in a for loop
8. Set all motors to 0 and LEDs to high using a for loop
9. Use 1st data line in a for loop to activate the motors in a series
10. Remap the value from 0 – 180
11. Use 2nd data line in a for loop to activate the motors in a series
12. Remap the value from 0 – 180

Programming and Physical Computing // Assignment 1 is a project of IaaC, Institute for Advanced Architecture of Catalonia Developed at Master in Advanced Architecture in 2018 by:
Student: Akshay Kumar Gopinath, Chou Jing-Wen, Lakshay Ghai, Logesh Mahalingam, Magesh Kumar Vellur Mathi and Tanvangi Asthana
Faculty: Angel Munoz, Cristian Rizzuti
