Stalking yourself is apparently a paradox. But certainly, tracking and creating a visualization of your own moves inside the city unveils patterns and logics in a very evident way.
What does the visualization contain?
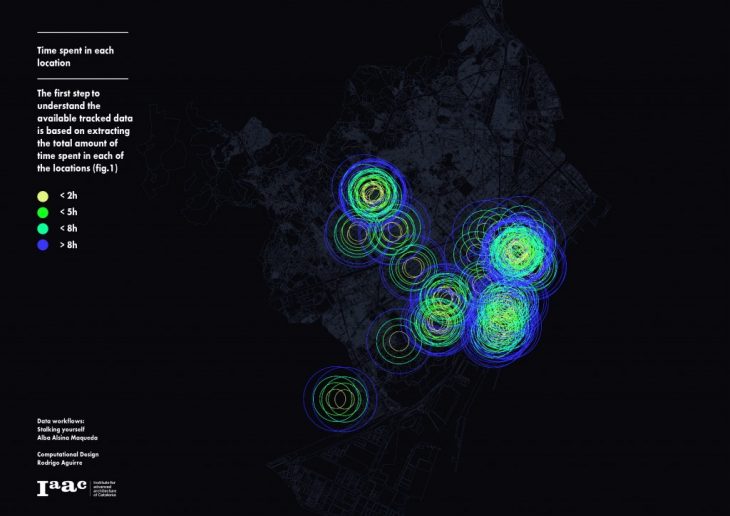
Where do I spend most of my time?
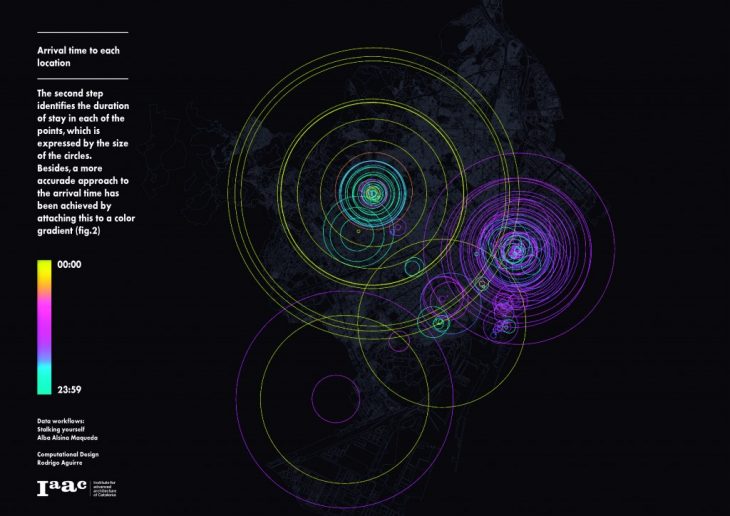
When do I arrive where? How long do I stay there?
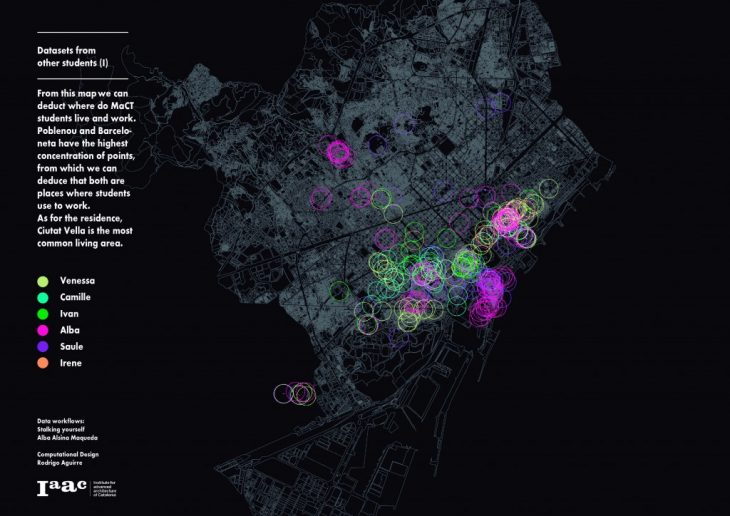
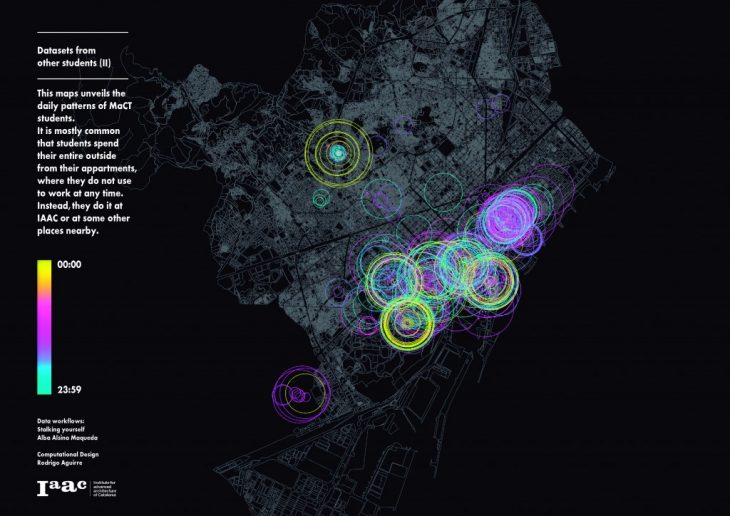
And what about the other MaCT students? What can we deduct from a common map?
How does it work?
Using the app ‘moves’ and ‘grasshopper’ to work with the extracted klm datafiles enables to understand our daily routines and relate our routines to spatial and time dimensions.
What are the results?
The results of this task have been the following:
First, a map showing the duration of stay of each point of location.Second, a combination of the duration of stay with the arrival time, from which it is easy to deduce what type of tasks are done in each of the location points.Third, a common map which shows the main location points for all MaCT students. Here you can easily deduct where everybody lives and what neighbourhoods are students working on for the FabCity course.Last, using the arrival time and duration script for all students enables a nice and easy to understand visualization on MaCT student’s life.
Stalking Yourself visualization – a paradox? is a project of IAAC, Institute for Advanced Architecture of Catalonia developed at Master in City&Technology, 2017/18 by:
Student: Alba Alsina Maqueda
Faculty: Rodrigo Aguirre
