Cities’ balancing act
Cities are complexities that balance on the border of order and chaos. There are always things that remain unchanged, but also dangers that we cannot predict. This becomes more apparent amongst a crowd, wherein situations can easily get out of control. People have been speculating about mob behavior since long ago and leaders in city governance generally find these crowds to be a source of anxiety.
“Men, it has been well said, think in herds; it will be seen that they go mad in herds, while they only recover their senses slowly, one by one” – Charles MacKay, Extraordinary Popular Delusions and the Madness of Crowds (1841)
“If an organization sets up teams and then uses them for purely advisory purposes, it loses the true advantage that a team has namely, collective wisdom” – James Surowiecki, The Wisdom of Crowds (2004)
The situation became more strained at the advent of advanced telecommunications. Being able to arrange ourselves digitally allowed for faster and uninhibited transactions. Thus, the digital space became another place for convergence.
Social Media in the City
Traditional methods of data collection are often slow, labor-intensive, expensive, and in some cases, have sparse results. The United States, for example, spent $13 billion on its 2010 census which is collected every ten years. Social media, however, is one fast and inexhaustible source of information that can be used in a multitude of ways. It can even be used by the citizens to take matters of the city into their own hands. Such was the case of the 2011 London Riots wherein massive mob violence started after the police shot down Mark Duggan at Tottenham, London in August 2011. This act of police violence resulted in a strong backlash across England. A series of protests and riots began, with people turning to free messaging such as BlackBerry Messenger, Facebook, and Twitter to plan convergence points. This allowed them to get a step ahead of the police and the Scotland Yard, therefore allowing the incident to ensue for four more days. This event resulted in massive damage to property, looting, arson, police assaults, and five casualties. In this case, social networks were used as a planning tool to retaliate against the government.
However, there are also cases wherein social networks facilitated positive relations between the government and the citizens. In 2006, Cory Booker was elected as the new mayor of Newark. He realized that there was an advantage to using new media to establish a trustworthy dialogue between the community and city hall. Booker created social accounts where he published incentive letters and inspiring quotes, and also retweet positive messages. His methods showed even more capability when the city was hit by a major snowstorm in December 2010. He received a lot of tweets asking for help and support. In the account of one of them was a message addressing the mayor to help a disabled man who requires help to which he responded with help. The following day, he personally helped clean the streets and inspired the citizens to follow suit. This shows that social media can assist with community-driven approaches, facilitation of public participation, and uniting people to face a collective problem.
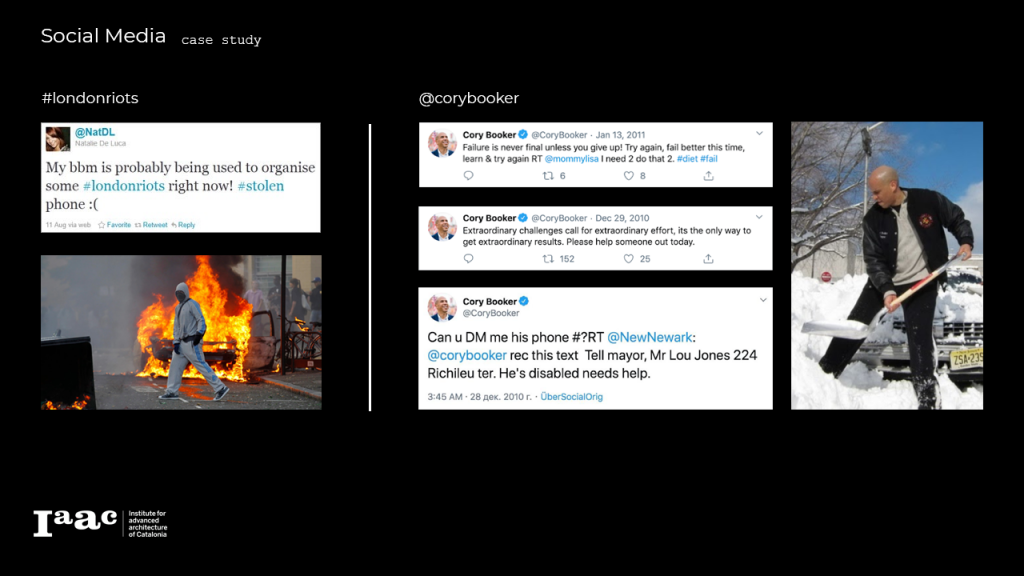
(Left) The 2011 London Riots; (Right) Tweets by Mayor Cory Booker of Newark
In reference to these scenarios, the project focuses on understanding the nature of social networks, its patterns and how they can be used to predict certain occurrences and create a beneficial dialogue between government and people.
A Model Based on Social Media
“Social media monitoring can help councils to better understand their residents. By setting up keyword searches relevant to local authority priorities and through active listening, authorities can better gauge what issues citizens have, what they are talking about and to respond accordingly.” – Civitas EU
Social media has the potential to be a planning tool for our cities. It has the possibility of becoming a monitoring tool, the capability to reveal public sentiment, and can provide valuable input for intelligence gathering. In order to draw this potential, the project took the city of Barcelona as a case study. For the dataset, Twitter was the preferred social media platform as it is a more accessible dataset and quite representative. It also contains a lot of data on users and their activities, which can be categorized as explicit or implicit data.
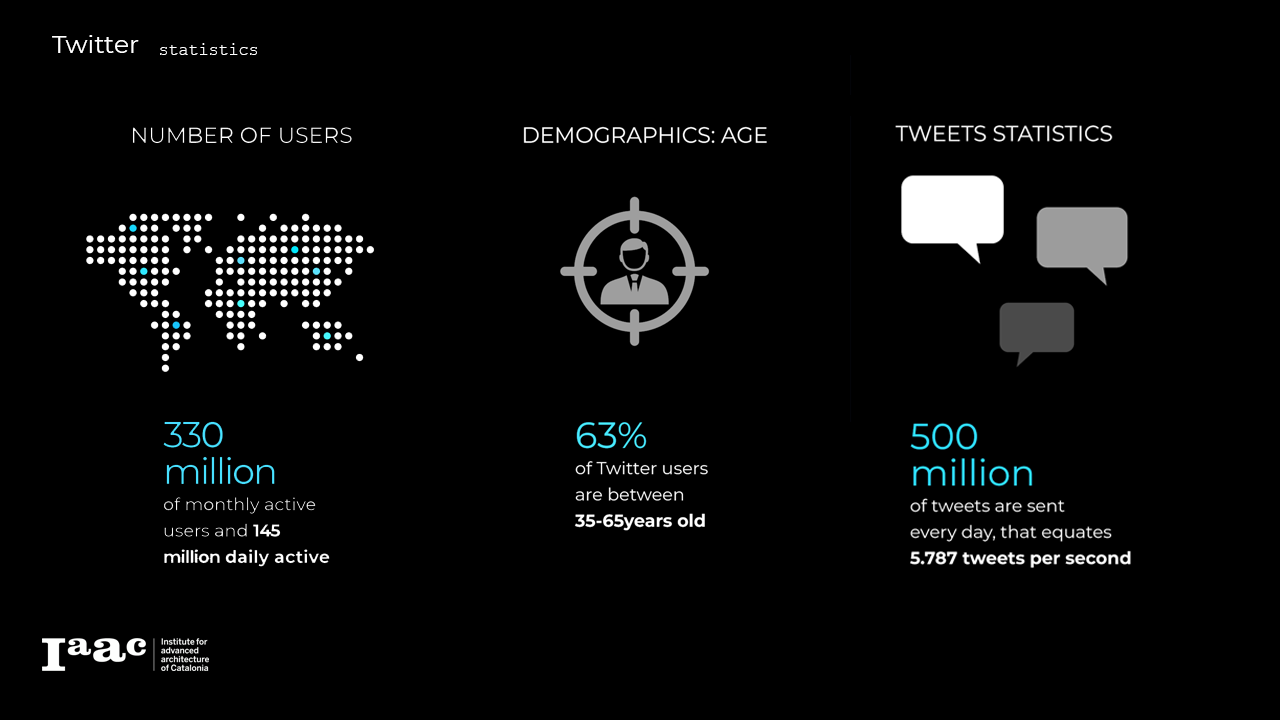
Twitter statistics

Twitter data collection and categorization
Using the explicit data that can be extracted from the chosen social media platform, the project geared towards finding event-oriented patterns in a temporal sequence.
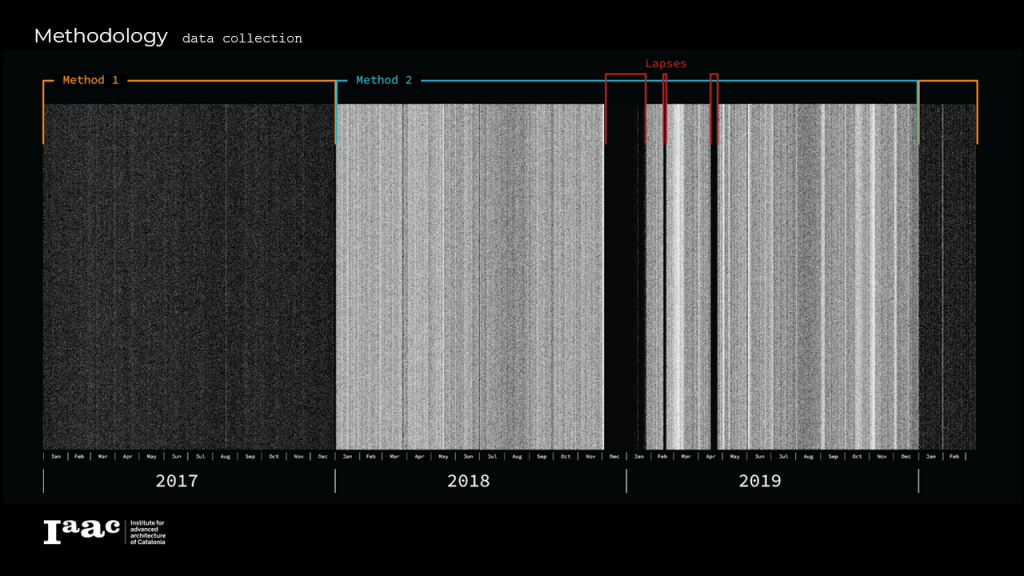
Data Extraction
Three years of twitter data were extracted from Barcelona; beginning in January 2017 until early March 2020. Two methods were used for this extraction. The first dataset was scraped using the GetOldTweets3 python library by Dmitry Mottl, while the second was provided by faculty Luis Falcon. The first dataset consistently has data for every day; however, there was a limit to the maximum number of tweets returned. In the graph below, the gap in the number of tweets between the two methods is apparent. On the other hand, method two provided a more substantial amount. In this case, however, there was only data beginning in 2018. Furthermore, there were lapses in days and even months. Both datasets will be used for the subsequent analysis, but done so irrespectively.
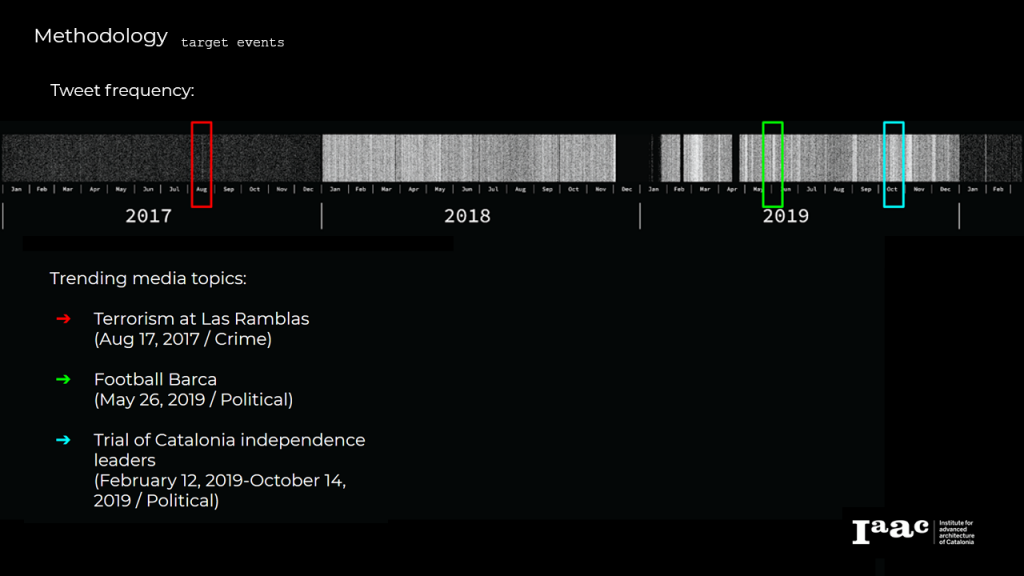
Twitter target events based on tweet frequency and trending media topics
Time-series sequence
The first objective of the analysis is to establish a time-series of occurrences with – a target event (the subject of the analysis), and topic correlations (words, phrases or hashtags commonly linked to the target event). The sheer amount of raw data necessitated the sampling of particular target events. These target events were chosen by identifying the most tweeted events through tweet frequency, and the most relevant topics in other media (news, other social media platforms, etc.) Filtering the data led to three notable target events: the terrorism at las Ramblas, football Barca, and the trial of Catalonia independence leaders.
Twitter target events based on tweet frequency and trending media topics
Topic correlations
The first target event corresponds to the concentration of tweets on August 17, 2017. This particular day is marked by an unexpected tragic occurrence. An act of terrorism at las Ramblas boulevard cost the lives of 16 people and left many injured. In order to pinpoint topic correlations, the group listed all the words from the dataset by order of frequency, and discounting articles. The extracted keywords were terrorism, pain, and terror which showed a pattern of dramatic change from the moment the attack started. This example of an unexpected event means a radical change not only in the physical space but also in the flow of digital information.

Identified keywords relating to the terrorism at Las Ramblas
In contrast with the first target event, football events are seasonal occurrences. The graph shows a constant flow of tweets throughout the entire year and having notable peaks on match days.
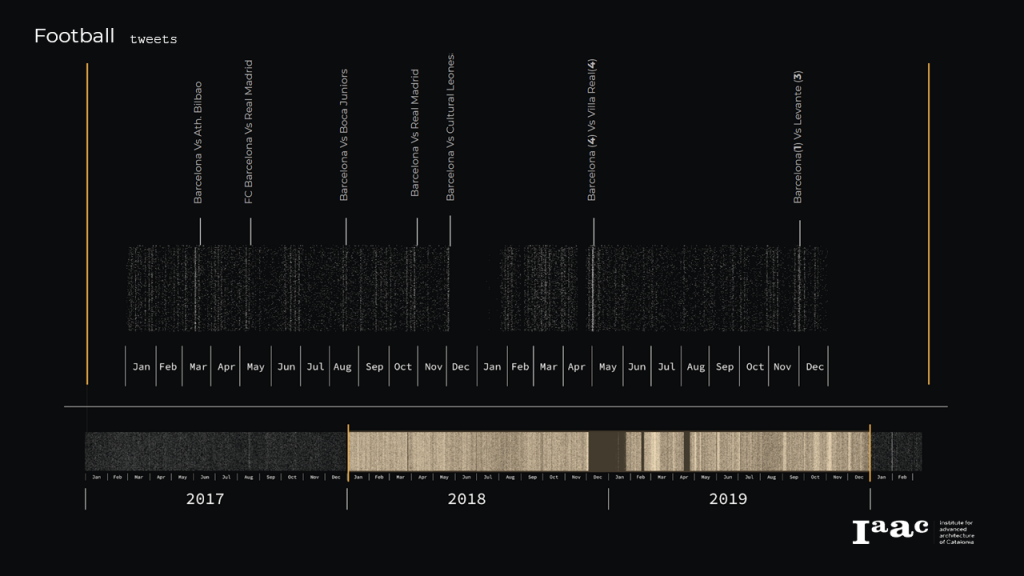
Tweet concentration on football match days
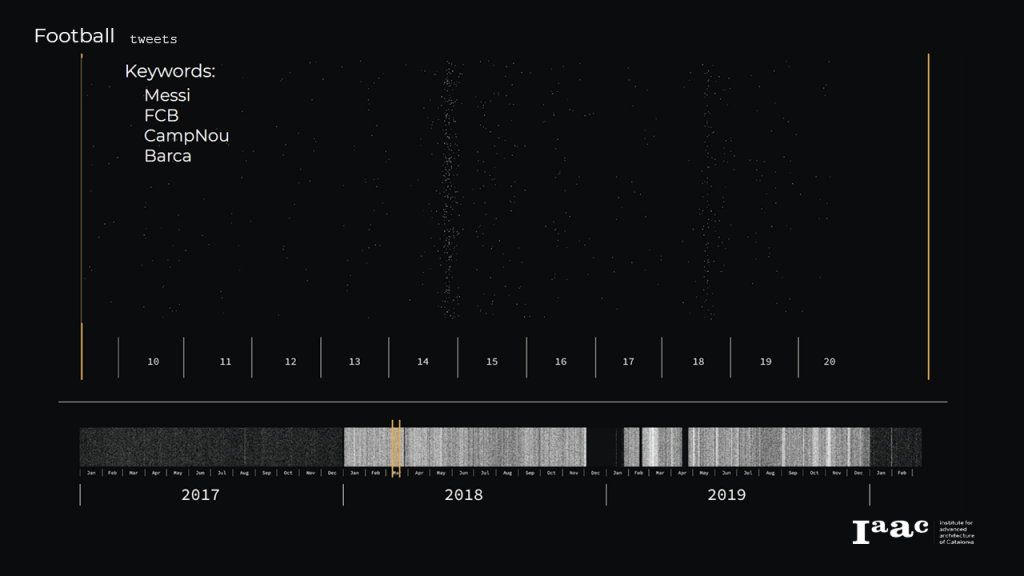
Identified keywords relating to the Football
The third target event is a long-spanning topic that still holds relevance. The trial of Catalonia independence leaders which began on February 12, 2019, ended on a guilty verdict on October 14, 2019. This spurred a massive backlash from the citizens of Catalonia from which, on the same day, a series of violent protests began. Organizing tweets by time and filtering them by keywords helps in giving a timeline of the public’s reaction to the events surrounding the independence movement.
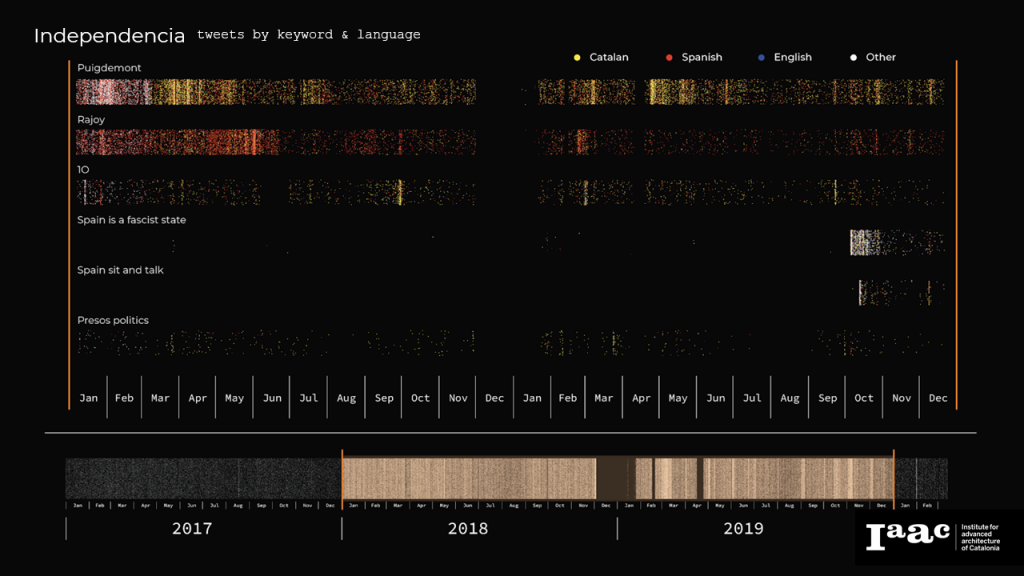
Independencia tweets organized by identified keywords and tweet language
Sentiment analysis using Node’s Sentiment module did not show any conclusive patterns. One thing to note, however, is the public’s sudden use of inflammatory hashtags (#spainisafasciststate) in response to the verdict then later responding with a calmer statement (#spainsitandtalk).
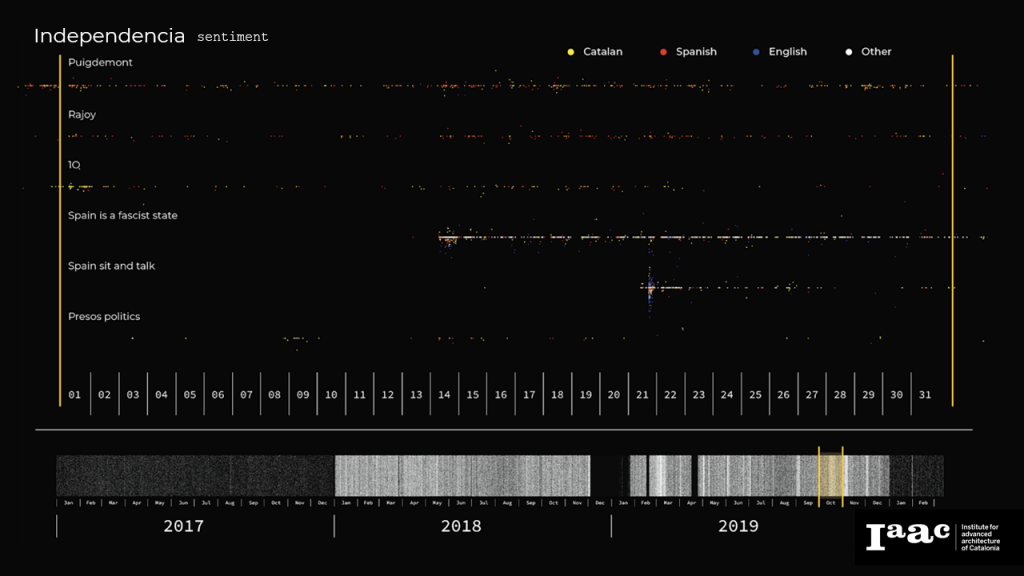
Sentiment analysis of Independencia tweets by keywords
Social media as input to policymaking
As can be seen with the above visualizations, the implicit data that can be extracted from social media has the potential to inform policymaking. This application can go two ways wherein the target user can be an individual or a collective
For individuals, take for example a case in the United States wherein a user directly violated twitter policy by insinuating that he will assassinate former US president Barack Obama. Not only was it a violation, he was actually arrested for it. In light of such events, the first proper step to the application of a policy with social media inputs is awareness. The city council must first properly disseminate information regarding data protection, the public’s digital rights, and also proper internet conduct, and violation consequences. There are two main references from which this project is basing policies from – the Twitter privacy policy and the New Spanish data protection law. After overlapping these two, the most noteworthy and relevant regulations to the project’s methodology were that:
- Non-public information about Twitter users will not be released to law enforcement except in response to appropriate legal actions or in response to a valid emergency request.
- The laws limit the consent granted regarding special categories of personal data such as ideology, union membership, religion, sexual orientation, race, creed, or ethnicity.
The second step to take would be to adopt these regulations. This was done so by categorizing the tweets through varying degrees of privacy wherein categories such as crime would allow for the lookup of personal information while cases such as social movements and public health & safety, if unrelated to crime, will be anonymous.
Besides individual cases, the greater opportunity for the use of social data would be, by the name itself – social movements and collective action. With the discussed method of pattern searching collective actions can be analyzed, thus making this the third step on building a potential policy.

Beginning with automated filtering:
First, in accordance with the data protection law tweets identified to be from users whose age is below 14 are automatically filtered out. What follows is the time-series analysis (wherein patterns could be keywords, sentiments or timestamps). In the case of October 14’s trial of the Catalonian leaders, the live-sentiment analysis and the appearance of negative keywords may have helped in preparation for the massive backlash that happened afterward. If there is previously logged data, this can also inform the city council of the possible reoccurrence of previous incidents. Following the search of patterns through time would be patterns through space. For example, the following clip shows a sequence of tweets relating to Independencia. From this visualization of tweets, what needs to be filtered in are collection/s of close points, with different user ids (unique id of tweet user) but sharing a common keyword/sentiment in a limited time window.
</p>
The following image shows that on a particular time window which is the 1st of October, 2019 varying users who are clustered together in one area are tweeting tweets with keywords such as 1O, llibertat, presospolitics. Referencing back to hierarchy, for non-criminal social movements personal info should not be disclosed. With this method of clustering, there is no need to know the users’ personal information – just correlations in topic, time, and space. The clusters can be a radius of contained points or a path of action.
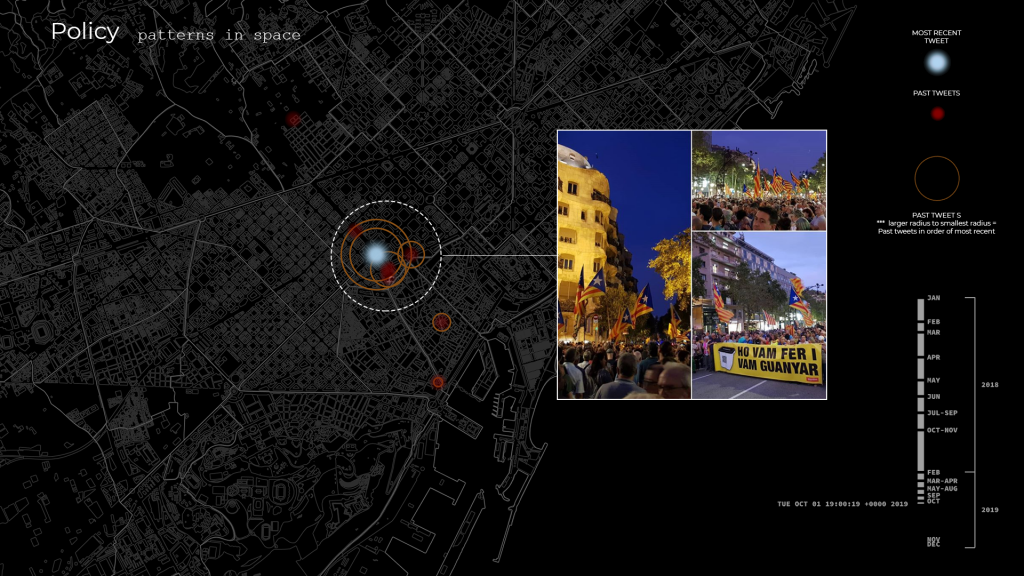
The analysis of twitter time-series and geo-location leads to an identified clustering in space which is in relation to Independencia.
Afterward is where human intervention comes in. Using city resources assigned personal can look through city surveillance footage, or reroute police patrols to investigate. In this case, the use of this analysis of clusters in space would be to observe how things proceed or escalate. The issue with this however is the limited amount of geo-located tweets. The methodology provided can be applied to any topic and can easily be redirected to tackle the most relevant topics. and the readily-available data that can be extracted from these social networking services can allow cities to prepare or respond more quickly than they would have before.
Dataset: Twitter, OpenData BCN
Sources: Twitter | Natalie De Luca (2011) | Cory Booker (2011) | Donte Jamar Sims (2012) | Twitter Privacy Policy; The Guardian | London riots escalate as police battle for control (2011) | What is the story of Catalan independence – and what happens next? (2019); BBC | Barcelona and Cambrils attacks: What we know so far (2017); FCB Barcelona; Gómez-Acebo & Pombo Abogados | The New Spanish Data Protection Act (2018); Oberlo | Twitter Statistics (2019)
Tools: Sentiment Node.js, GetOldTweets3
Social Event Patterns is a project of IaaC, Institute for Advanced Architecture of Catalonia developed at Master in City & Technology in (2019/2020) by:
Student: Elijah Munn, Michelle Rodriguez, Linara Salikhova & Rovianne Santiago
Faculty: Luis Falcon