”Sociable Spaces” focuses on the question of how we can make public spaces more sociable. The proposal investigates different layers of data that may affect social interaction and coherence and attempts to propose a strategy of intervention to improve sociability in selected areas.
In order to understand the complexity of the Social Economy field, we started with an extensive background review about the topic, firstly by understanding the local Policies and Framework related to it, as well as projects and research that focused on the intersection between Social Economy and the urban environment. The goal was to assess which are the main areas of research on this topic within the city scale.
Challenges
After a broader understanding, we were able to infer the main challenges regarding social and economic fields, which are intertwined and directly impact the urban environment. Social challenges affect people’s personal and economic relations, such as the recent pandemic and low interaction in public spaces, leading to lack of sociability and community feeling. Whereas on the economic side, gentrification, non-affordability and, therefore, inequality affect social participation and generate non-inclusive spaces
From these main conclusions, we were able to determine our primary approach: to make neighbourhoods more inclusive and foster social interaction. And the impacts of this action wouldn’t simply be the addition of new vibrant places. Social spaces also create economies and increase economic value while improving livability and enhancing communities.
Methodology
Through extensive research, we identified 12 indicators of social coherence and interaction. These layers are first analyzed and then categorized into 6 categories of sociability (Affordability, mixity, diversity, safety, attractiveness and connectivity). This helps to understand the performance of the area in every category. A clustering algorithm is then deployed to create delimited areas which have a similar behavior on each of the 6 categories. In parallel, footfall data of the same location is analyzed to identify “hot spots” of sociability. These are identified based on areas with the highest footfall facilitating social interaction visualized into a sociability map. Next, the sociability map is intersected with the clusters to understand which clusters have the highest footfall in order to then understand the performance of these clusters in relation to the 6 categories of sociability. This procedure helps us identify which categories influence sociability the most and consequently propose strategies to improve these in order to increase the sociability of desired locations.

Social interaction indicators
From the main references of the background review previously mentioned, we identified the quantitative and qualitative indicators that in any way influence sociability, not simply taking them from these references, but also analyzing how each stimulates or not, the creation of inclusive sociable neighborhoods. They are: average income, rental prices, amenities, schools, elderly homes, offices, visibility, abandoned plots, popularity, number of trees, area of green space, street furniture & facilities, travel continuity, pedestrian streets and population density.
To measure these indicators we used a grid of 66,5 x 66,5, because this distance of the grid is based on a walkable area of two minutes, and each square is located for the axes of the road to the center of the building. because we understand that the road is a barrier in terms of sociability. Each indicator was measured differently, based on the importance of their categories.
Categories of Sociability
From the social indicators map, we categorize them into six groups and normalize them between 0 to 1 to further study the influence on sociability value.
- Affordability: Affordable places are inclusive places. In order to assess affordability, we have analyzed the presence of different socioeconomic groups living in each area through their average income, and the rental prices of existing houses, identifying their ability to pay for it and the possibility of social inclusion.
- Mixity: The analysis of mixity was focused on the presence of diverse amenities, the distances and the accessibility to them. We understand them as points of attraction for different kinds of social interaction.
- Diversity: The diversity analysis aimed to identify the distinct users of the space for evaluating the inclusiveness of current social interactions. This analysis was based on the presence of institutions attended by different age groups: schools, which are related to a younger population; offices, which are related to working adults; and lastly, elderly homes, which are related to older citizens.
- Safety: Unsafe places are places where people are not willing to socially interact. For assessing safety, we have focused on the visibility of public spaces and streets, as paths that are not clearly visible may discourage users, as well as on the presence of abandoned plots, which are frequently associated with unsafe and unwatched urban spots.
- Attractiveness: In order to evaluate the attractiveness of the spaces, we have analyzed their popularity based on online reviews and pictures posted, as well as the physical elements that usually attract people, such as number of trees, which provide shade and outdoor comfort; area of green spaces, which are locations that encourage social interaction; and street furniture and facilities, which are responsible for stimulating the use of public space.
- Connectivity: Ultimately, we analyzed connectivity, with the identification of pedestrian streets, which foster walking social interactions, in addition to the analysis of travel continuity, or in other words, the continuity of existing routes, which stimulate walking, and therefore, the interaction previously mentioned.
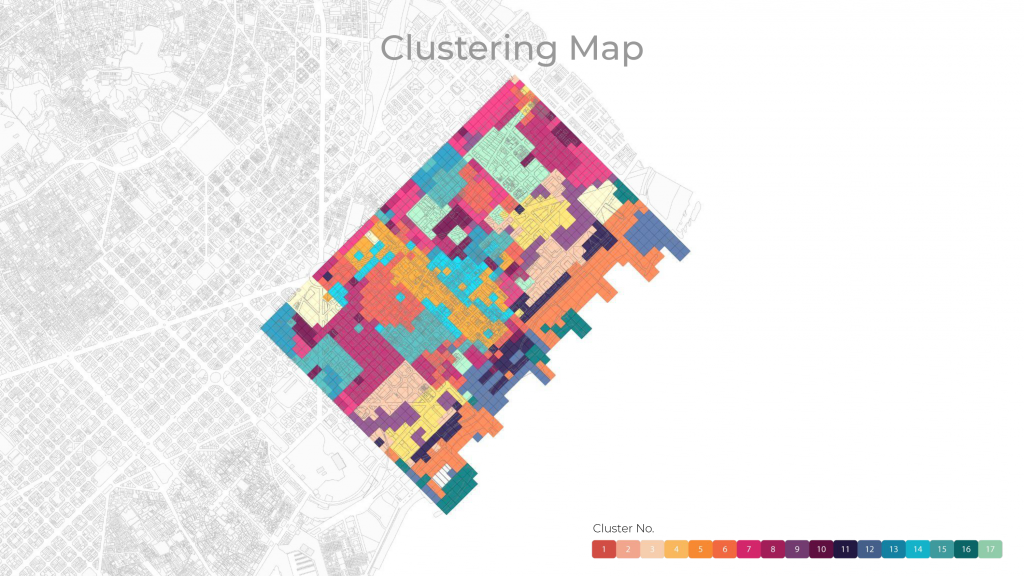
Identifying regions with similar behavior
To understand correlations between different categories, we performed two different clustering methods, SOM and Hierarchical algorithms. After testing a different number of clusters in each method, we identified a better behavior with 17 clusters through the Hierarchical method. In this way, we can identify the correlation between the footfall data and the censal areas. And through box plots, we identify the behaviors of each cluster on the six categories.
People distribution and footfall
Once the clusters have been confirmed and analyzed, what we do is to analyze the footfall data to later establish a correlation with the type of cluster. The main ingredient to be able to socialize is people and that’s why we consider using this data as a confirmation source. By tracking the routes and measuring the time each user spends in each place we are able to understand how people use the space and which ones are more or less used. We reconstruct the data in a map which shows the distribution of people.
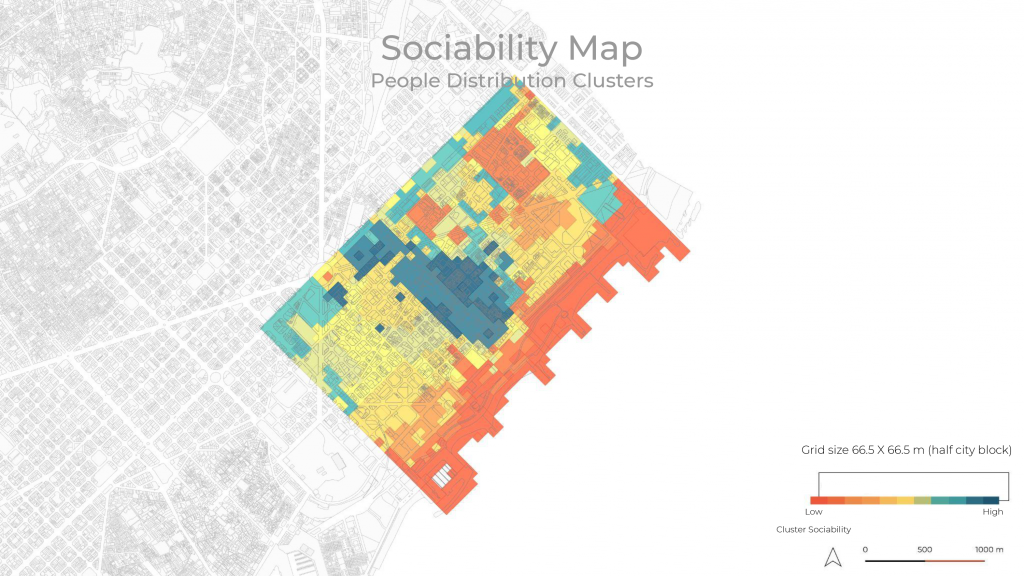
Extracting sociability
The next step is to look for the correlation between the distribution of people and the type of cluster they fall in in order to understand which clusters accumulate the highest percentage of people and which the lowest. Here we can see the map, which goes from low sociability in red to high sociability in blue. Comparing both maps we can understand better the relation between the clusters and the footfall data. From this analysis, we conclude that clusters 14 and 5 are the most crowded while 17 and 4 are the least.
When we compare the performance of each of the clusters in each category we observe that the categories of mixity and connectivity are higher in those with higher sociability. On the contrary we observe that in clusters 17 and 4 the categories of affordability, diversity and attractiveness are higher.
We now move on to the last part of our methodology. Once we have understood how the different categories of space influence sociability, the next step is to elaborate on different strategies that allow us to modify the different sociability performances of each cluster.
Proposal – Strategies to increase sociability
As case studies, we focus on cluster 5, the Rambla de Poblenou and part of cluster 17 that belongs to the 22@ plan. As we have seen, they are opposite cases in terms of sociability, however, both clusters can contribute positive things to each other. The main strategy is to convert the 22@ area into a new social node, importing the learnings from the rambla de poblenou and maintaining the positive aspects
In order to ensure that the future district 22@ provides for high social interaction we use la rambla de poblenou as an example to set the values for mixity and connectivity. However, at the same time and as we’ve seen, areas with high social interaction are sometimes lacking in several categories. We also want to learn from 22@ in reverse and improve quality of life in rambla de poblenou.
Our interventions are split into design and policy proposals. We first look at district 22@, in order to increase mixity we identify the amenities needed in proportion with the size of the cluster. So in this case we need to add 88 restaurants for example, almost 150 stores, 20 public spaces and other amenities like theatres and social services. We also need to add pedestrian streets in order to increase pedestrian connectivity. Here we propose to continue the superilla plan and connect to the green routes which are already under construction. We identified the number of mobility stations also required in this area. And as a policy, we propose the temporary closure of some roads on weekends to be used for pedestrians which has already been done before. Finally we see how all of these interventions will help increase both mixity and connectivity which in turn would bring more footfall and sociability to this area making it a new social node.
As for Rambla de Poblenou, in this case we would like to increase affordability. And for that we first propose to allocate some of the existing abandoned plots for affordable housing. And then as a policy, to support local businesses through tax reductions, and encourage entrepreneurship through training programmes. Another category we need to improve in rambla de poblenou is diversity. And our diversity analysis was based on the proportions of different age groups and demographics in the area. For that one of the facilities needed are more educational facilities to bring younger population such as schools and institutes, more integration of elderly homes and fasciitis which we found lacking in the catchment area of rambla de poblenou. And we propose these to also be added in abandoned plots or some of the buildings to be converted where possible. And finally more integration of work offering such as offices and co-working which also provide a wider variety of users in the area. As a policy, we would like to promote activities and events oriented towards different age groups. After the interventions on affordability and diversity we will see a better performance in this area and hopefully a better quality of life.
What we get as a replicable outcome of our proposal is a kit of parts, designed to improve each indicator and therefore each category. It mandatorily needs to be combined with the numerical and spatial analysis we have developed, in order to tailor the application of the kit to each specific case, obtaining an informed proposal that would be further developed by the designer with the public participation.
In conclusion, from the analysis of the current situation of both Rambla de Poblenou and District 22@, we were able to identify the elements that could be improved. And we hope that through our proposals we will be able to create more diverse, resilient and social communities.
Below you can find a video where we summarizes the project:
Social Economy – Sociable Spaces is a project of IAAC, Institute for Advanced Architecture of Catalonia developed at Master in City & Technology in 2020/21 by students: Laura Guimarães, Kevin Aragon, Iñigo Esteban Marina, Sridhar Subramani and Leyla Saadi and faculty: Angelos Chronis, Iacopo Neri, Mahsa Nikoufar and Androniki Pappa