
Introduction
In Puerto Rico, Climate Change and its effect tend to be spoken about in somewhat abstract terms. While the effects of Climate Change have been widely discussed through the media, effects on the local scale have yet to find the same sort of publicity. The sheer complexity of the problems and its effects might difficult linking the big issues with local problems. Lack of information of the risks at the local level impedes the development of timely responses. It also impedes the possibility of naming and identifying stakeholders that are at risk. In order to address this issue this work’s objective is to identify the impact of Sea Level Rise on the Business sector, Critical Infrastructures and Tourism industry throughout the 21st century in Puerto Rico.
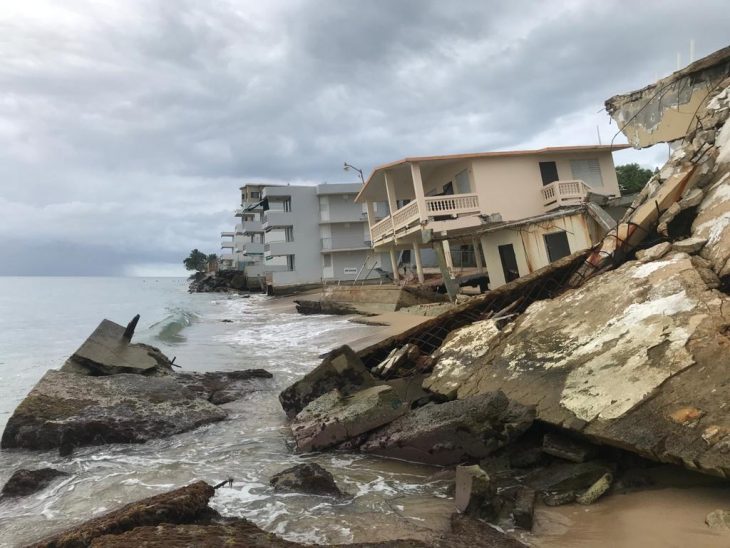
Collapsed beachfront developments in Córcega Beach, Rincón, Puerto Rico. Source: Mario González Nevárez, 2020
Problem Statement
Sea Level rise is one of the biggest risks associated to Climate Change. Countries in the tropics will be particularly affected by Sea Level Rise (SLR). Due to the earth’s gravitational field and rotation, the Mean Sea Height Level (MSHL) will rise quicker and reach a higher level in places near the Equator (Gould, et al. 2018)
Puerto Rico is an Island Nation that is part of the Antilles Archipelago which divides the Atlantic Ocean and the Caribbean Sea. Puerto Rico has been registering a 2mm/y increase in MSHL since the mid 20th century (Sweet et al., 2017 and Zervas et al., 2009). That being said, the trend for yearly increase has been accelerating by a factor of 3 since the 2010.
The National Oceanic and Atmospheric Administration has modeled a series of projections for SLR based on three different Green House Gas (GHG) emission scenarios for the present century. The projections estimate how much the MSHL will rise at determined locations. Each projection has been adapted to represent the estimate MSHL under each GHG scenario. The GHG scenarios are based on how much GHG is present in the atmosphere. In this work, we will only consider data for the extreme SLR scenario because it si consistent with current GHG emission trends. In this scenario the MSHL is expected to rise .6m by 2040, 1.21m by 2060, 2.13m by 2080 and 3m by 2100 (Gould, et, al. 2018).
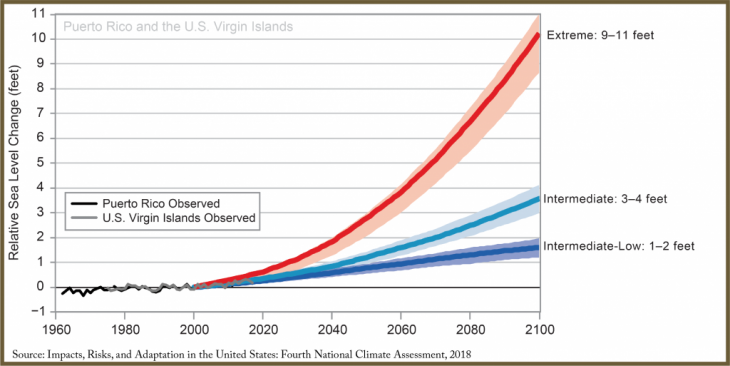
This graph illustrates the Sea Level Rise scenarios for Puerto Rico throughout the 21st century. Each scenario is based on a different Green House Gas emission scenario. Source: NOAA
As a Tropical Island Nation, Puerto Rico’s development is strongly tied to its international ports, its coastal cities and its coastal landscape. San Juan, the Capital of Puerto Rico, and its extended metropolitan area are located in the Islands northern shore. By itself, San Juan concentrates a substantial amount of critical infrastructure (airports, power generation plants, hospitals, etc.) and the largest and densest agglomeration of businesses and homes in the Island. In similar fashion, a significant amount of the Islands Touristic amenities are located in the coastal zone. While the majority of San Juan’s territory is further inland (thus out of our current SLR risk areas) most of the amenities and infrastructures are located near the shore.
Determining the impact of SLR is paramount to the development of mitigation and adaptation strategies. In order to do so, this project explores the spatial relationship between Flooding Risk (caused by SLR) and Businesses, Critical Infrastructure and Touristic lodging (BCIT). Housing and Office space have been left out of this research due to a lack of data.
Methodology
In order to assess the impact of SLR on the BCIT, the SLR shapefiles where overlayed on the BCIT points. A geoprocessing tool was used to identify the points that fell within the SLR shapefiles. Since each SLR model presents a different reach in flood impact, individual percentages where calculated for each BCIT category for each SLR model. Percentage calculations where based on the relation between the number of points that fell within the overlayed SLR shapefiles in comparison to the number of points that did not. The product of this methodology are sets of three percentage values (one for each BCIT category) per SLR model.
This GIF illustrates the expansion of the area impacted by Sea Level Rise between 2040 and 2100 and the BCIT variables. Source: NOAA, PRPB and OSM
Data Management
This work uses various “bathtub” type models of SLR developed by NOAA and a myriad of points that identify the location of Businesses, Critical Infrastructure and Touristic (BCIT) lodging within the coastal area. The NOAA SLR models where used in ESRI Shp. format. Four depth categories where chosen for this study: +.6m, +1.21m, +2.13m and +3m. These depth categories where chosen because they coincide with the expected rise in MWSL in 20-year intervals spanning between 2040 and 2100.
The point data for the Businesses and Tourism Lodgings was sourced from the Open Street Maps (OMS) database, while the Critical Infrastructure point data was gathered from the Puerto Rico Planning Board (PRPB). In order to create the BCIT categories, various data management tools where used to clean, organize and join the numerous variable subcategories into the main BCIT. Each of the BCIT categories where then filtered further as to only include points within coastal municipalities. The final sets that define each main variable are defined as following:
Business: (Banks, Shops, Grocery Stores, Restaurants, Café’s, Post Offices, Bakeries, Bars, Gyms, etc.)
Critical Infrastructure: (Hospitals, Police Stations, Fire Station, Main Power Plants, Main Water Plants, Airports and Sea Ports)
Tourism: (Hotels, Motels, Guest Houses, Lodges)
While this work regards with high confidence the quality of the data from government sources (NOAA and PRPB), the data extracted from the OMS server is recognized to be incomplete. The amount of data-points that where used to generate the Business set is much less than what should be. A visual comparison between the OMS data and the Google Maps navigation portal, plus intimate local knowledge of the study area attest to the discrepancy. None the less, at the moment this research was conducted, the OMS database was the only known open-source repository with the desired data.
Results
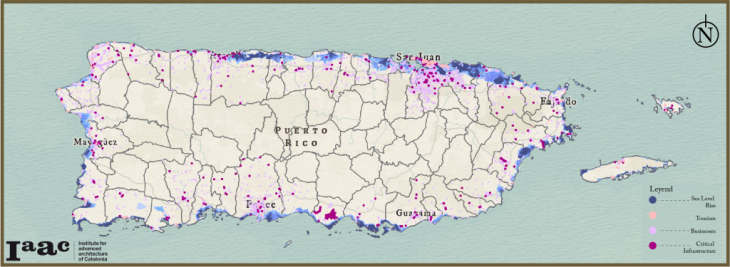
This map identifies the BCIT points along the coast and the flooding expected by 2100
The percentages product of this research illustrates the magnitude impact SLR will have on the BCIT categories over time. The Tourism Industry will se its exposure to SLR risk increase from an estimated 2% in 2040 to 34% by 2100. The Island’s Critical Infrastructure will rise in risk exposure from a seemingly unimportant risk exposure of .5% in 2040 to a worrisome 14% by 100. Based on the data gathered, the Business sector’s risk exposure will grow from a 0% in 2040 to a 8% in 2100.
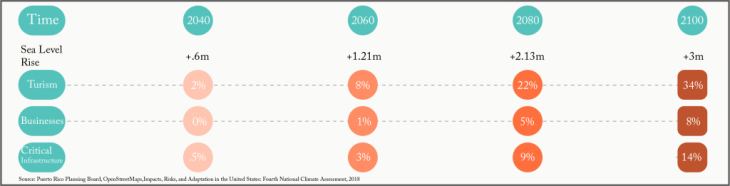
This graph illustrates the estimate percentage of Businesses, Critical Infrastructure and Tourism Lodgings that will be affected by Sea Level Rise in Puerto Rico throughout the 21st century
Analysis & Conclusion
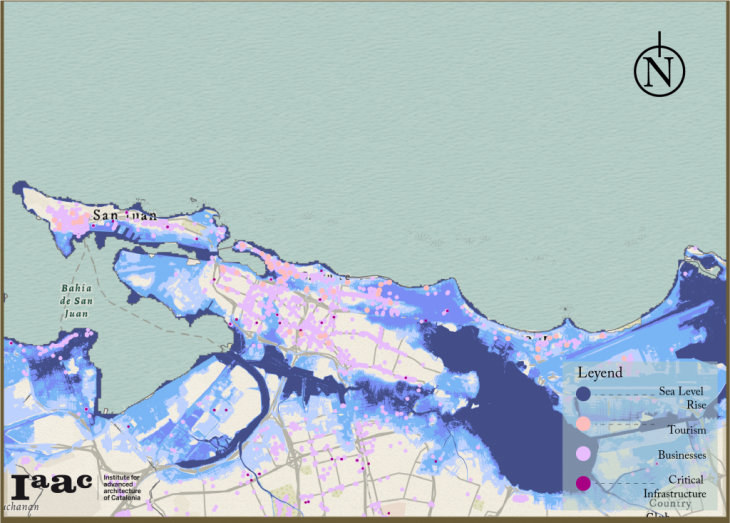
This map illustrates the impact of Sea Level Rise on the BCIT categories in San Juan, Puerto Rico. Source: NOAA, PRPB and OSM
While the results from the Critical Infrastructure and Tourism variables are not unthinkable, it is worth noting that not all variables have the same impact. One of the limits of this study is the aggregate nature of the data points. This is particularly relevant in the Critical Infrastructure variable. While we may conceptually agree that Power Stations and Hospitals are equally important, if one of the main power stations in the Island where to shut down, this would affect the operational capacity of a significant number of Hospitals. Likewise, the impact of SLR on the main seaport of the island has a multiplying effect on all other variables used in this work.
As commented before, the data used to construct the Business category was understood to be insufficient. Considering the significant amount of commerce that revolves around the coast, the results seem to be a gross underestimation of the impact SLR will pose. None the less, the results expose how vulnerable the city of San Juan, and Puerto Rico to some extent, is to SLR.
Generating and Visualizing information on the effects of any problem Is the first stem to raise awareness and provoke action. While a lot of emphasis is placed on the general effects of Sea Level Rise, there is much work to be done at visualizing and analyzing its effects at the local scale. This work hopes to help push the conversation at the local level by linking risk, time, location and stakeholders, we can determine the identity of those affected through time. Developing data with this level of detail is essential to begin planning for near-future scenarios. Considering the political and economic complexity of planning strategies in urban areas, the temporal dimension of this work may help put in perspective the urgency required by local officials in order to properly address issues such as SLR.
Project Credits
Sea Level Rise in Paradise, is a project of IAAC, Institute for Advanced Architecture of Catalonia developed at Master in City & Technology in 2020/21 by student: Mario González Nevárez, and faculty: Diego Pajarito.
References:
Gould, W.A., E.L. Díaz, (co-leads), N.L. Álvarez-Berríos, F. Aponte-González, W. Archibald, J.H. Bowden, L. Carrubba, W. Crespo, S.J. Fain, G. González, A. Goulbourne, E. Harmsen, E. Holupchinski, A.H. Khalyani, J. Kossin, A.J. Leinberger, V.I. Marrero-Santiago, O. Martínez-Sánchez, K. McGinley, P. Méndez-Lázaro, J. Morell, M.M. Oyola, I.K. Parés-Ramos, R. Pulwarty, W.V. Sweet, A. Terando, and S. Torres-González, 2018: U.S. Caribbean. In Impacts, Risks, and Adaptation in the United States: Fourth National Climate Assessment, Volume II [Reidmiller, D.R., C.W. Avery, D.R. Easterling, K.E. Kunkel, K.L.M. Lewis, T.K. Maycock, and B.C. Stewart (eds.)]. U.S. Global Change Research Program, Washington, DC, USA, pp. 809–871. doi: 10.7930/NCA4.2018.CH20
Sweet, W. V., R. E. Kopp, C. P. Weaver, J. Obeysekera, R. M. Horton, E. R. Thieler, and C. Zervas, 2017: Global and Regional Sea Level Rise Scenarios for the United States. NOAA Tech. Rep. NOS CO-OPS 083. National Oceanic and Atmospheric Administration, National Ocean Service, Silver Spring, MD, 75 pp
Zervas, C., 2009: Sea level variations of the United States 1854-2006. NOAA Technical Report NOS CO-OPS 053. National Oceanic and Atmospheric Administration, National Ocean Service, Silver Spring, MD, various pp.
https://coast.noaa.gov/arcgis/rest/services/dc_slr/
http://www.gis.pr.gov/Pages/default.aspx
https://www.openstreetmap.org/export#map=14/18.4509/-66.0491