Introduction
Satellite imagery is one of the most potent and primary tools used by the meteorologist. They are essentially the eyes in the sky. These images reassure forecasters to the behavior of the atmosphere as they give a clear, concise, and accurate representation of how various events are happening on Earth.
For this session, the main objective is to understand the potential use of satellite imagery in analyzing urban patterns and paradigms through utilizing the available advanced tools one can have such as Python and Qgis. With its decades of layers of information, urban planners, designers, and developers can have a wider perspective in terms of different urban phenomena such as climate change, allocation of water resources, anticipation and response to natural disasters, etc. at the same time, this tool can monitor and support decision-making towards a more sustainable future of our built environment.
Aside from adding a new layer of knowledge, satellite imagery also highlights the importance of spatial resolution as each type holds a unique set of data waiting to unfold.
Methods, Data and Key Concepts
Satellite imagery is a set of images of Earth and other planets captured from imaging satellites. It has evolved all throughout the centuries starting from a simple aerial photograph taken in Paris, France (1858) to thousands of openly-available images in the web in today’s generation. There is no doubt that it proved its importance in understanding our world down to how we make decisions in our daily lives.
In addition, this particular type of data provides detailed analysis for creating and/or updating GIS maps which could detect major changes in the urban fabric at different time sequences.
As mentioned in the previous paragraph, knowing what spatial resolution works the best on a specific research is probably the most important thing one should do first. There are different dimensions to choose from depending on the scale and extent of analysis.
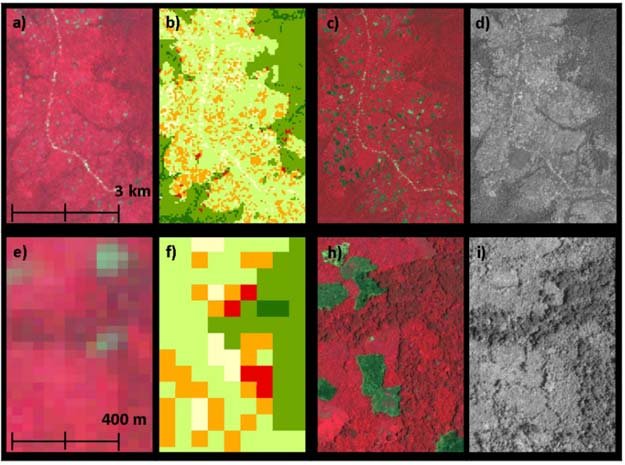
Quantification of land cover and land use within the rural complex of the Democratic Republic of Congo (
https://www.researchgate.net/publication/320053069_Quantification_of_land_cover_and_land_use_within_the_rural_complex_of_the_Democratic_Republic_of_Congo)
The sample image above shows how one scale of resolution could lead to different interpretations, analyses, and applications due to the spatial limits it portrays.
Principal Outcomes
The presence of satellite imagery becomes very useful in city planning as it is open sourced and relatively easy to obtain. Remote sensing has long been widely used in resource inventory, land use change monitoring and many other applications. In urban planning, first of all, remote sensing is regarded as an important data source for monitoring urban expansion and land use change analysis.
Satellite-based remote sensing holds certain advantages in monitoring the dynamics of urban land use because of the large spatial coverage, high time resolution, and wide availability. Pixel-based image classification methods using spectral and/or textural properties are frequently applied to extract urban land use information.
A lot of vegetation indices have been assembled more focused to the characteristics of low red and high near infrared reflectance, including the most widely used index, Normalized Difference Vegetation Index (NDVI). The normalized difference vegetation index (NDVI) is one of the most essential guidelines of detecting changes in urbanized areas, specifically when it comes to land use /cover land cover changes caused by human activities like construction and other developmental projects. Another widely used index for detecting changes in urbanized areas is based on Normalized Difference Built-up Index (NDBI).
Survey
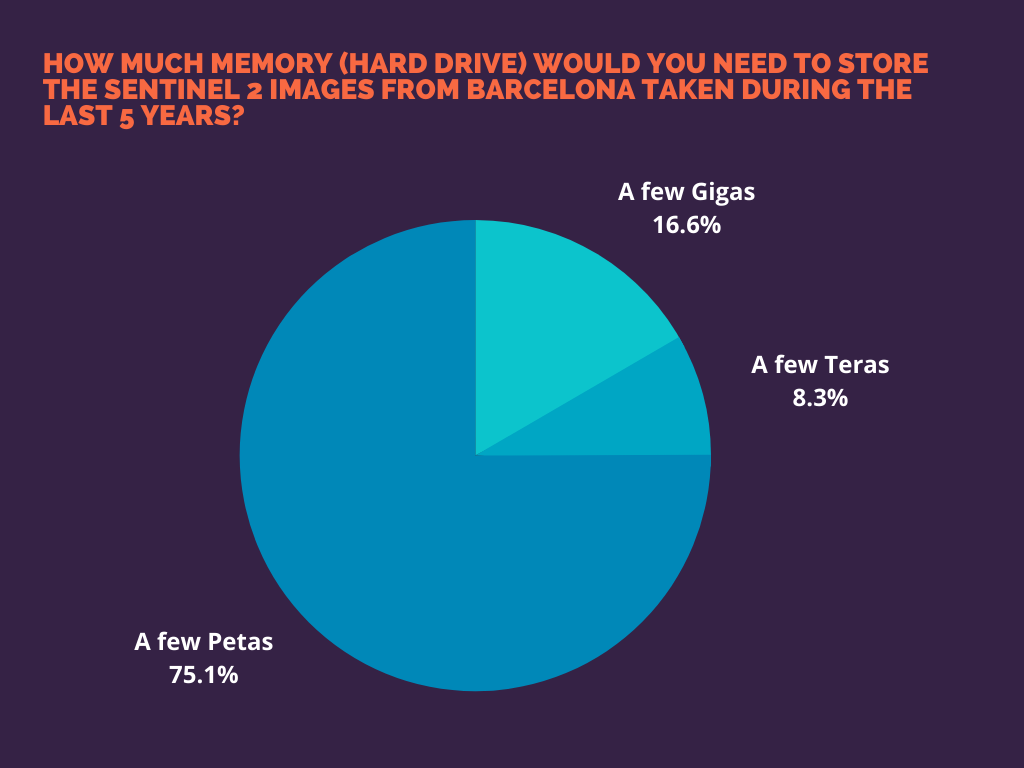
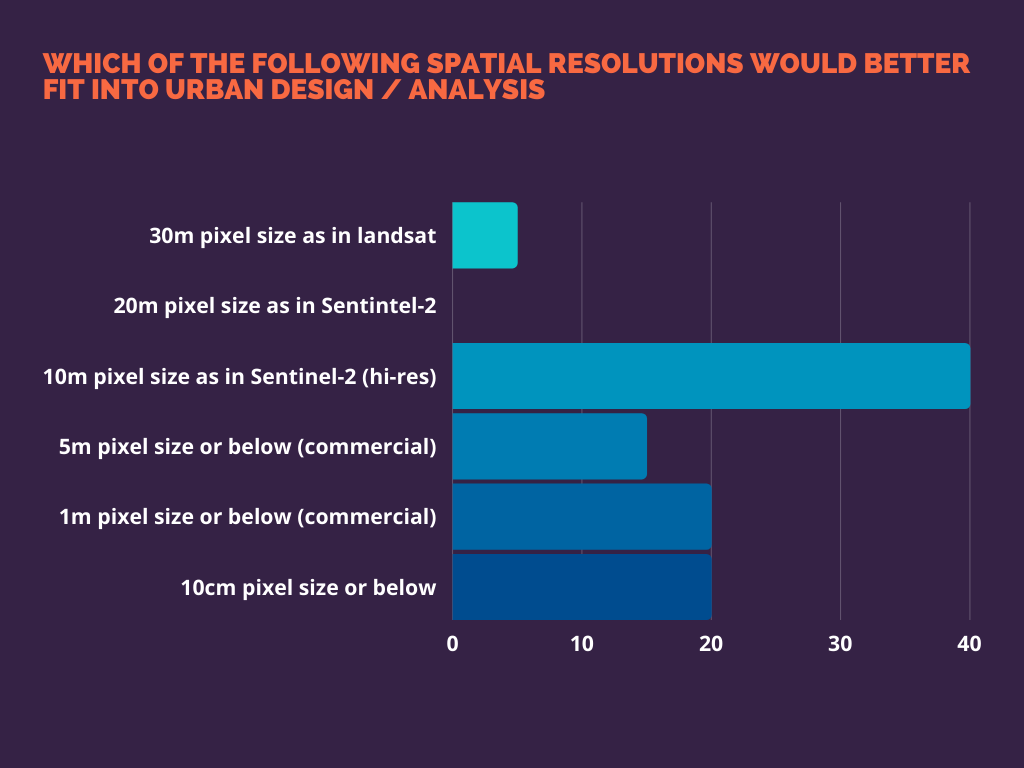
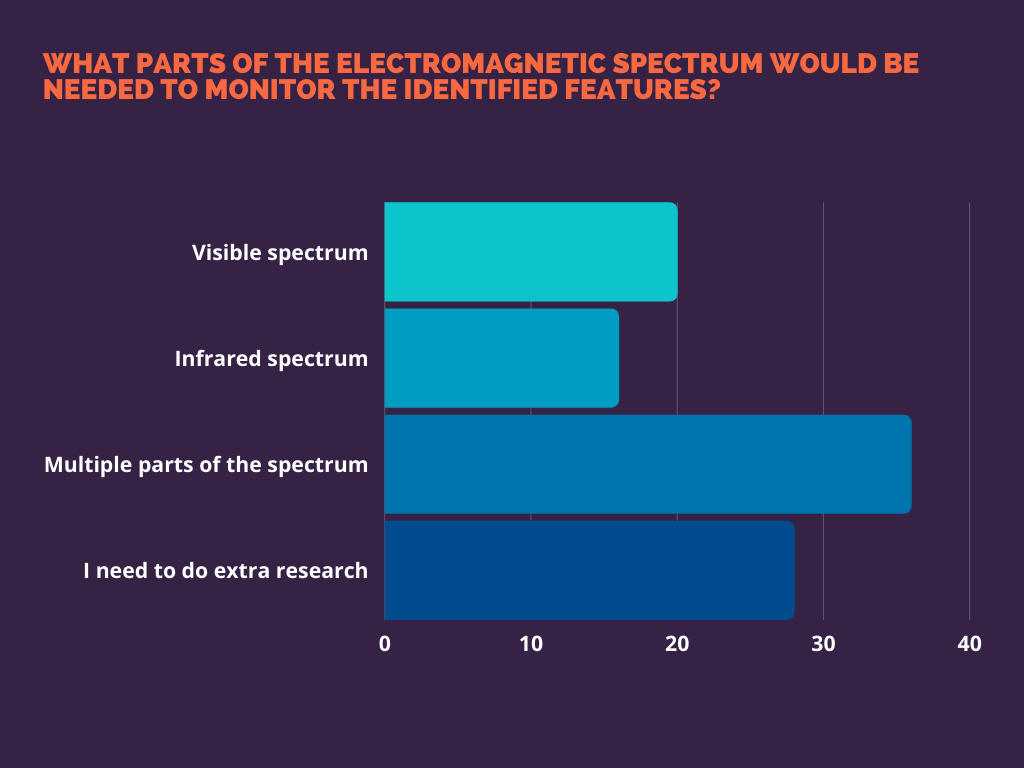
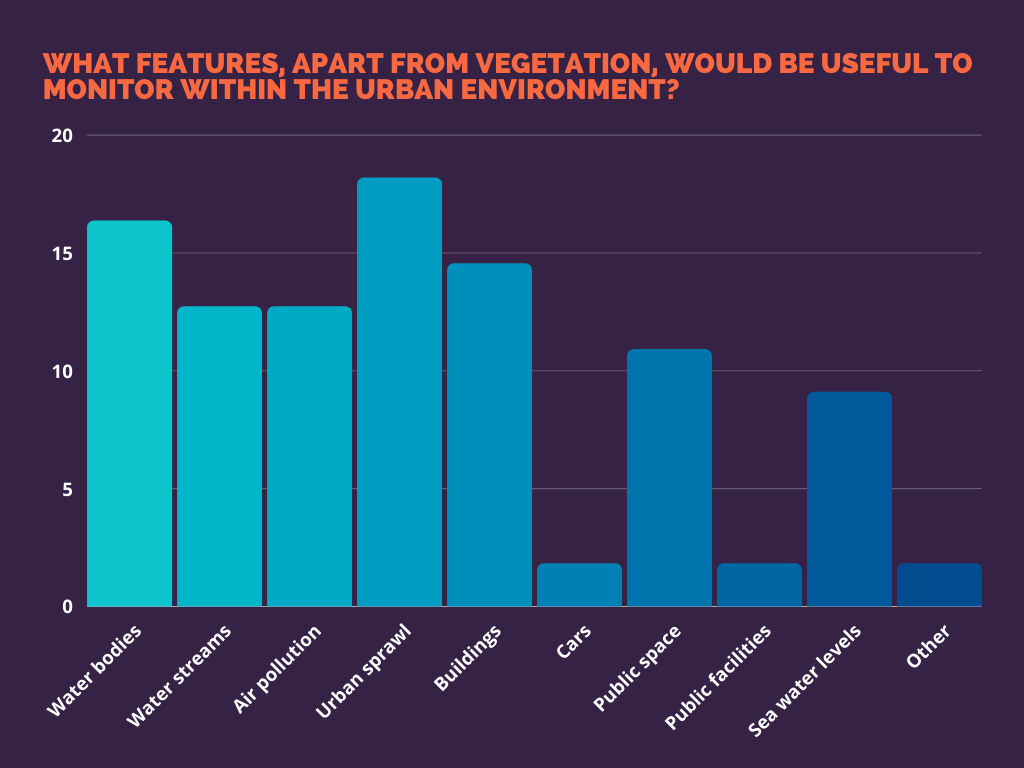
With this technology, various kinds of analysis can be done for a decision making process in urban planning. Below is an image showing the result of a survey taken by class of MaCT regarding which data coming from satellite imagery is most potentially useful for urban design. The following images are other surveys taken.
Conclusions
Satellite imagery is indeed a powerful tool to explore especially in urban planning.
Although we are still experiencing certain limits and biases in using satellite imagery as a tool in urban planning and design, there is no doubt that the possibilities could be endless. It is just a matter of knowing the right procedure to use. Who knows, maybe in the future there will be what we could call, “microscopic satellite imagery”.
Thus, we can draw an important conclusion : satellite images are extremely useful in the study of urban patterns and natural resources. Using a number of programs, including python and qgis, you can process satellite images using graphical indicators (NDVI, NDBI, NDWI, etc) as a result, researchers can make meteorological forecasts, study solar radiation, atmospheric phenomena, analyze the state of soils and flora, water resources, and so on.
Based on high-quality data obtained using satellite images , specialists from various fields have the opportunity to create effective strategies to solve current problems : global warming, water and soil pollution, the deterioration of the Earth’s atmosphere, etc.
We would like to believe that in the future, with the further development of technologies and improved monitoring of the state of the Earth, it will be possible to mitigate the consequences of global disasters, forget about the problem of hunger and make people’s lives much better and safer.
References / Bibliography
- www.usgs.gov/faqs/what-remote-sensing-and-what-it-used?qt-news_science_products=0#qt-news_science_products
- en.wikipedia.org/wiki/Normalized_difference_vegetation_index
- www.gisresources.com/ndvi-ndbi-ndwi-ranges-1-1/
Satellite Imagery is a project of IaaC, Institute for Advanced Architecture of Catalonia
developed at Master in City & Technology in (2019/2020) by:
Students: Aryo Dhaneswara, Jianne Libunao and Rashid Gilfanov
Faculty: Diego Pajarito