Brief
Analysing human activities within a defined space, collecting and storing data of these activities by using detection and tracking algorithms and utilizing the collected data to implement it in processes of space optimization
Before Detection and Tracking Algorithms
Example of tracking activities of people, observing, analysing and using that data to optimize the space so that it enhances the operation of those activities
Objectives
Use technology to our advantage to collect and store data of activities that are performed within a defined space.
- Analyse human activities within a defined space
- Collect and store data of these activities by using detection and tracking algorithms
- Utilize the collected data and implement it in processes of space optimization
Experimentation Area
Testing space : a working environment that facilitates multiple activities throughout the day.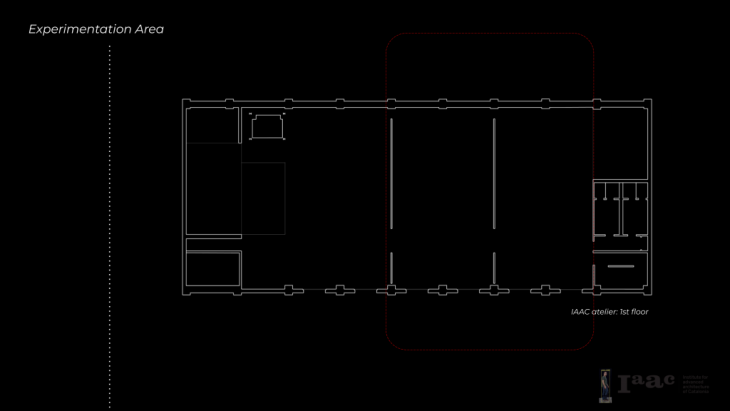 Current Methods
Showcasing some current methods of how spatial analysis is currently being evaluated: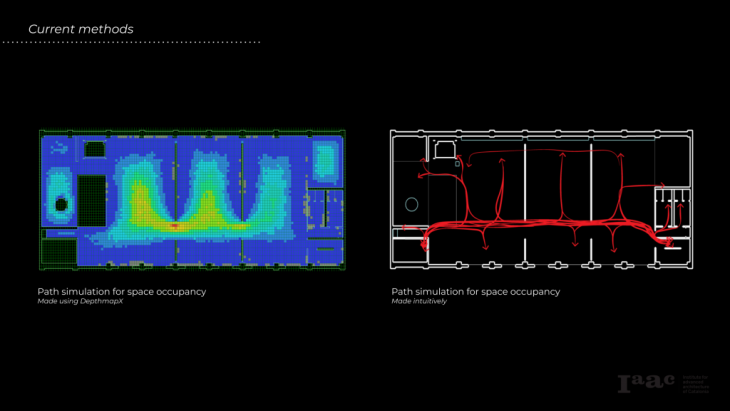 Initial Approach: Optical Flow
To extract data for out analysis we initially used “Optical Flow”. Optical flow or optic flow is the pattern of apparent motion of objects, surfaces, and edges in a visual scene caused by the relative motion between an observer and a scene. What is “Optical Flow”?
Optical Flow finds points of interest in a frame and tracks those points.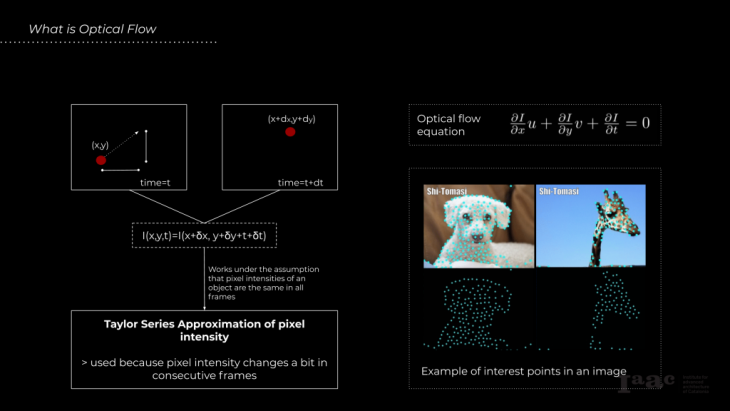 Initial Experiment – Outcome
However, there is no control on the location of those points. Optical flow does not isolate object that are moving (people, animals, furniture etc.) In addition, reflections and shadows of a moving object are also becoming part of the trajectory. With Optical flow, while the trajectory of a moving object is being tracked, the end result becomes uncontrollable and noisy. Object Detection
This lead us into object detection. There are several object detectors. One of the first being R-CNN. However, RCNN is very slow because it extracts proposals from different regions of the input image, computes features by using a large CNN and classifies each region.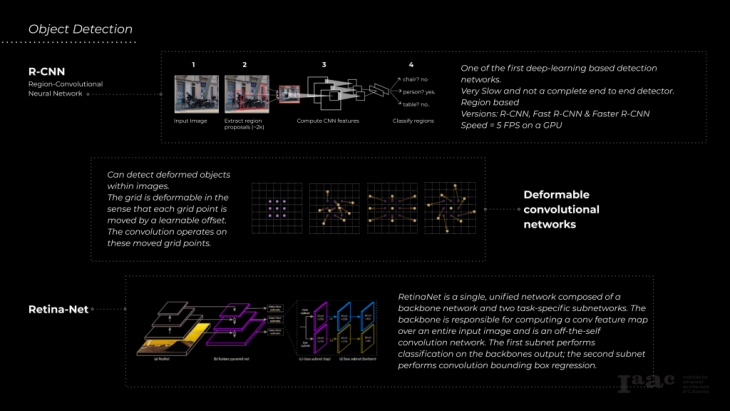 YOLO
YOLO
We chose to use YOLO, which is faster since we are using videos and we can get a speed of 45 Frames per Second. In addition, YOLO achieves object detection, classification and localization trained on a specific dataset. COCO Dataset
COCO dataset is trained on 200,000 images of 80 different categories (person, suitcase, umbrella, horse etc…). It Contains images, bounding boxes and 80 labels. COCO can be used for both object detection, and segmentation, we are using it for detecting people.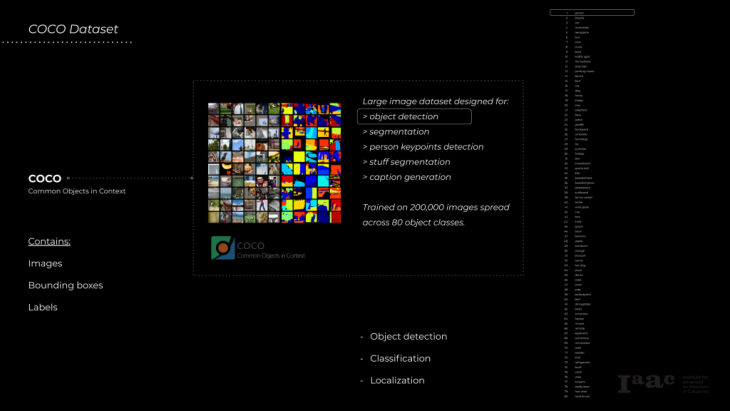 OpenCV
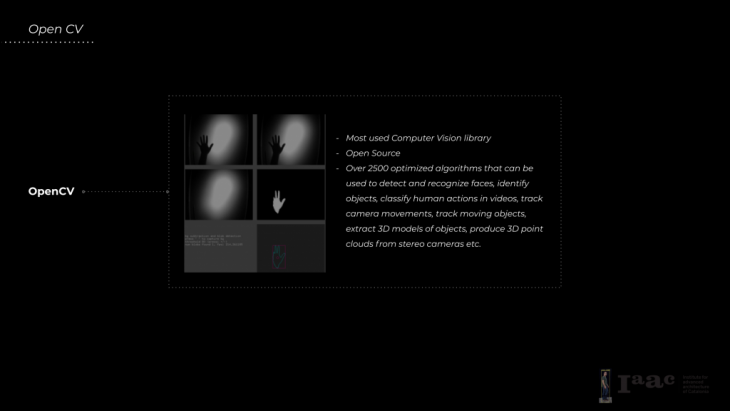
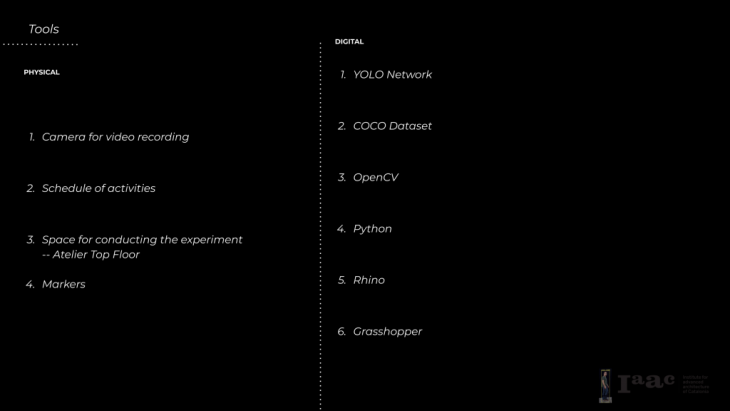
 Tools
Tools
 Data Extraction – Methodology
We Input a video into the YOLO network. YOLOv2 trained on COCO dataset performs the object detection and localization. We create and output video through which we are able to visualize the detections with the Class IDs and confidences for each single detection. In addition, we use the algorithm to store points (x,y) in empty lists that we created and export them in a .csv file that we can later use to get the positions of the tracked objects.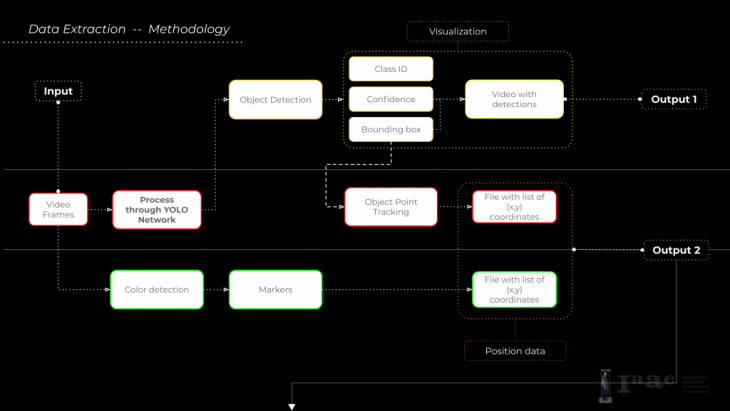 Data Visualization – Methodology
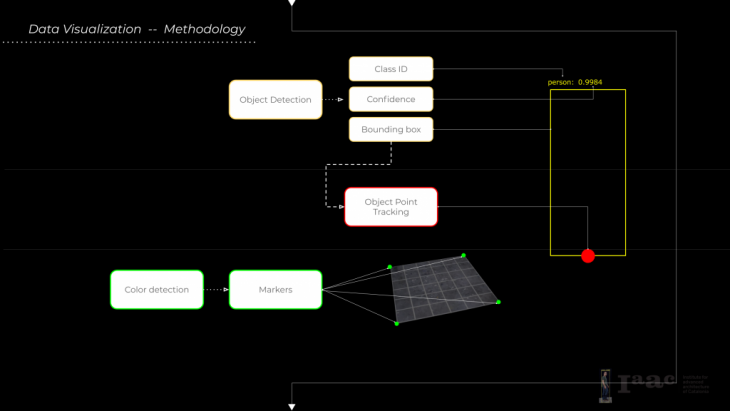 How YOLO Works
YOLO performs object detection by creating a rectangular grid throughout the entire image. Then creates bounding boxes based on (x,y) coordinates. Class probability gets mappedby using random color assignment. To filter out weak detections, a 50% confidence is being used (this can change) which helps eliminate unnecessary boxes. (Right) this is what an output image looks like after being put through the neural network. Filtering Out Class IDs
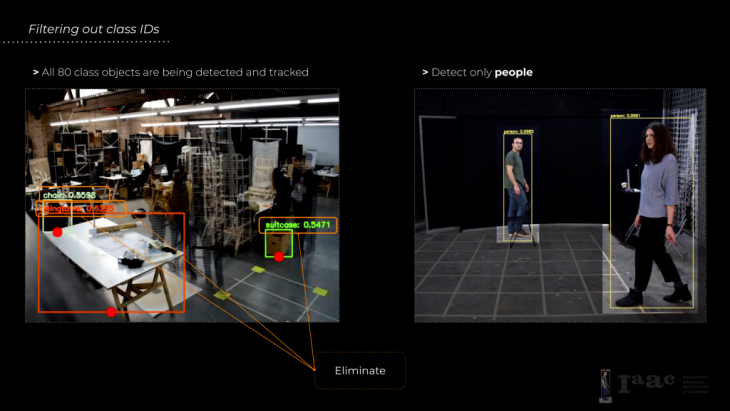 Mapping of Data — Methodology
The video output is necessary to visualize the data. However, to map the data from a video, we need a process that can map those points on a 2D plan. We use Homography inside Grasshopper to read and process the files that contain the list of (x,y) coordinates.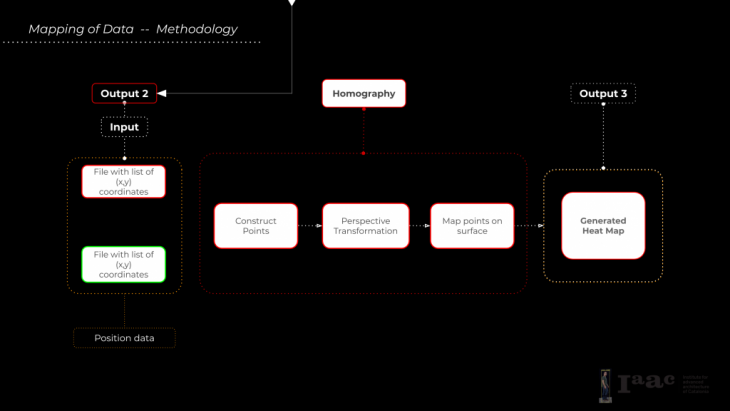 Failures:


Workflow
What we need for the homography process: 3 types of points
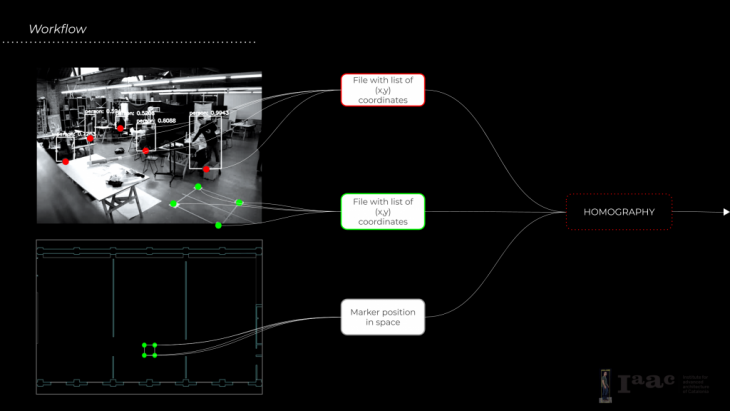 Homography process: Relating two images, or in our case sets of points, by defining a plane they have in common which we do by using markers. Then the points from the video are mapped to the floor plan and we can start generating the heatmap.
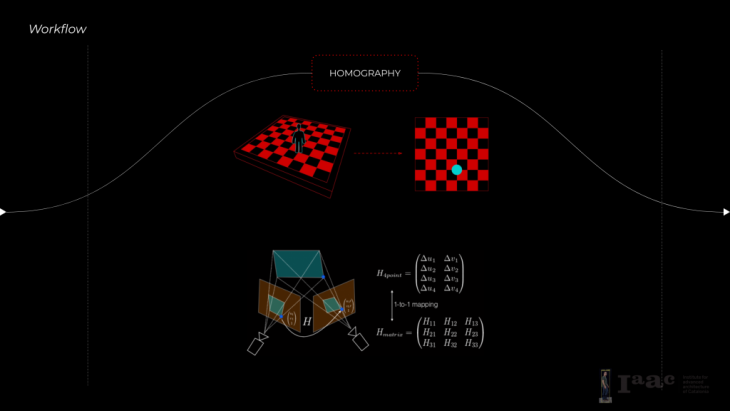 Test 01:
This is one of the first videos we used to test this process:
Here you can see the difference between the points from the video and when we map them to the floor plan: Test 02:
In the later tests, we started working in the space upstairs:
After mapping the points we started generating a heatmap.
1. divide space into grid
2. count point in each square
3. assign color to square by the number of points that are in it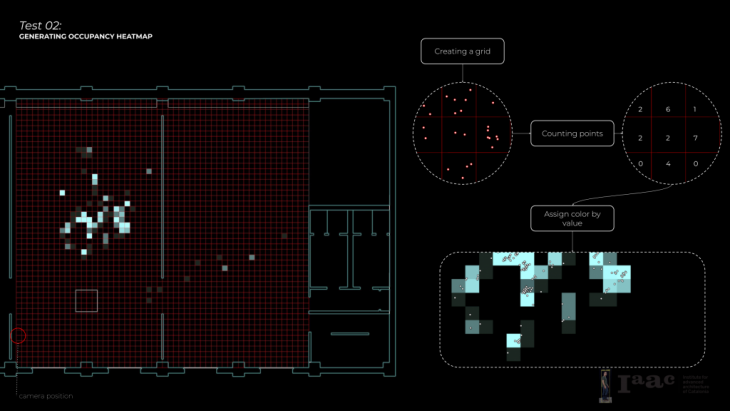 Test 03:
The result displays which areas of the space are being used more frequently. We tend to use this information in the design process and to be able to generate floor plans based on activity after analysing the results based on a bigger dataset.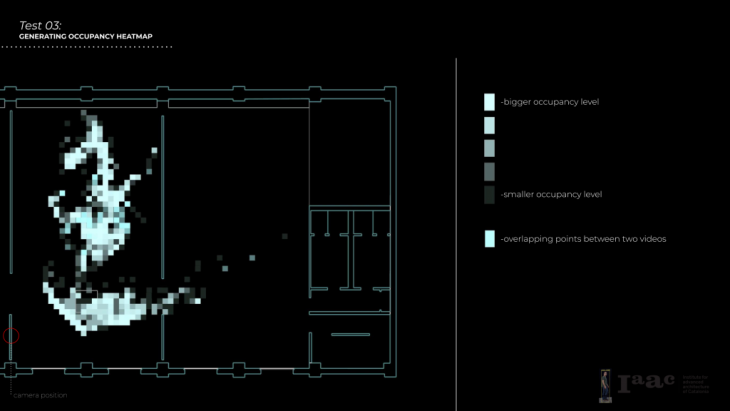 Summary:
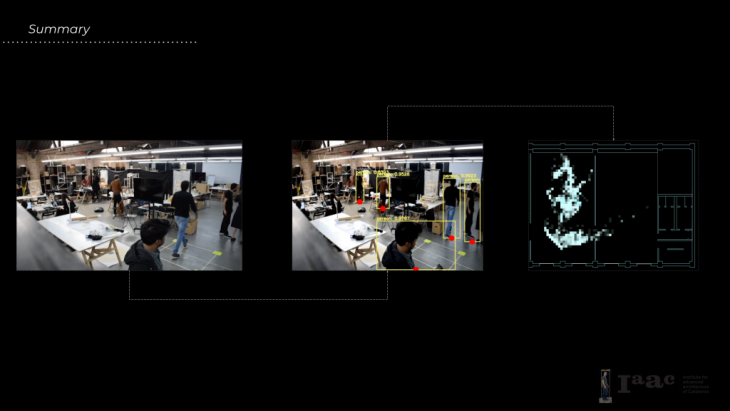
Record-Collect-Project is a project of IaaC, Institute for Advanced Architecture of Catalonia developed in the Masters of Robotics and Advanced Construction in 2019/20 by: Students: Elena Jaramazovic, Gjeorgjia Lilo, Irem Yagmur Cebeci Faculty: Angel Munoz, Soroush Garivani