Prefabricated House Generator with Artificial Intelligence
PROJECT CONTEXT
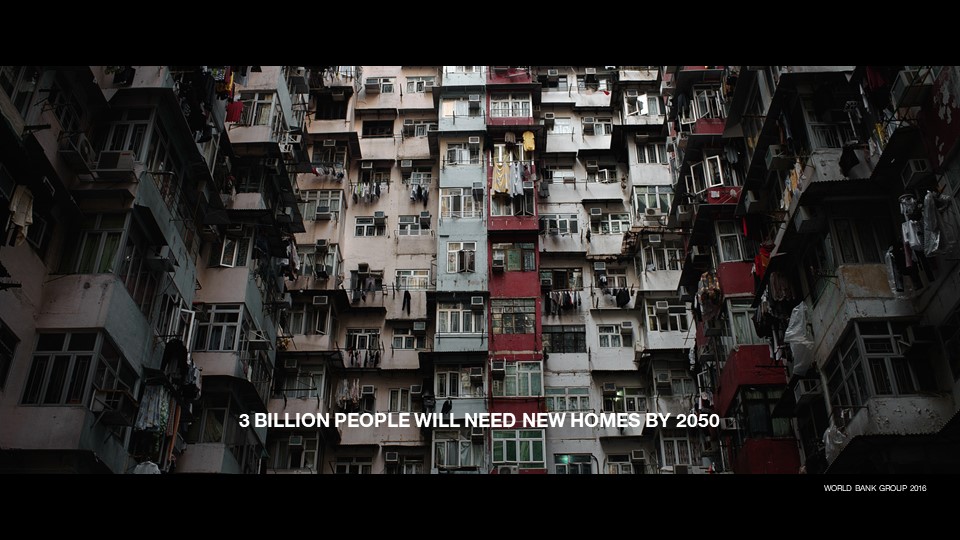
The housing shortage problem has already spread all over the world. By 2050,we estimate that approximately 3 billion people might need a new place to live.
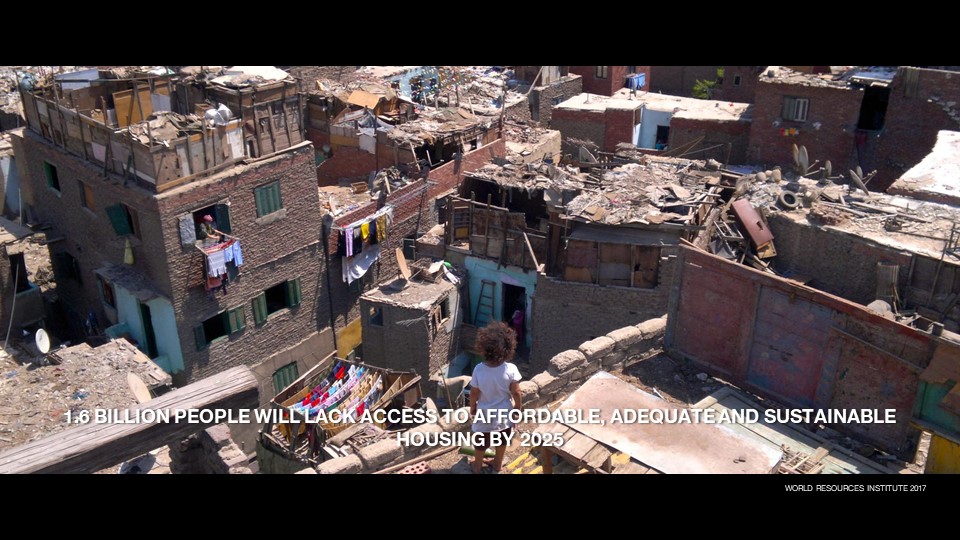
More than 1,5 billion people are already having a problem to get affordable, adequate and sustainable housing in 4 years from now. Particularly, about over 80% of people in developing countries build their houses without any help of architects and engineers. This situation stimulates our interest in this project.
In order to increase sustainability, productivity and decrease construction time and cost, we look at prefab houses.
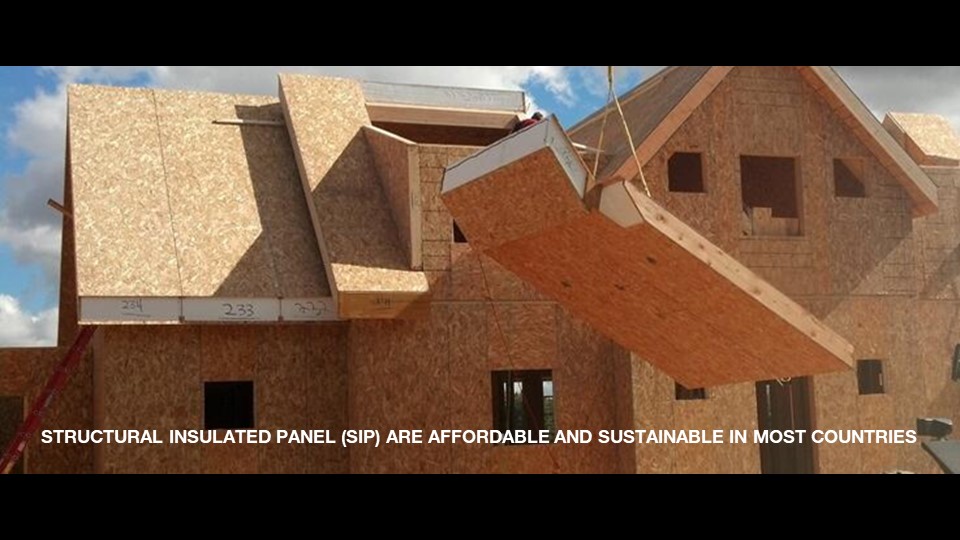
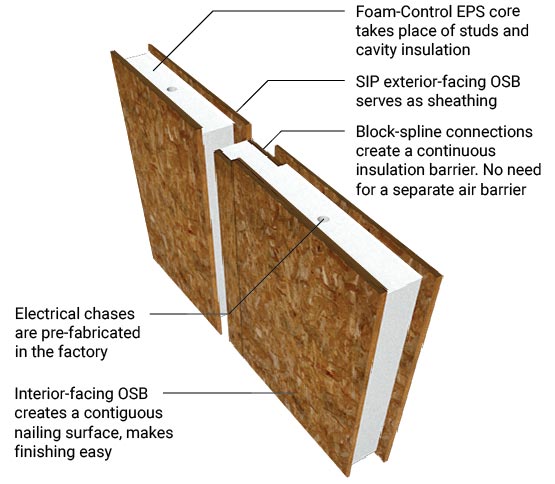 A SIP (structural insulated panel) house can be bought from a panel factory that has minimum design requirement. Then the panels can be assembled with ease at the construction site. This prefab system propose a great affordability and comfortable ambiance for inhabitants.
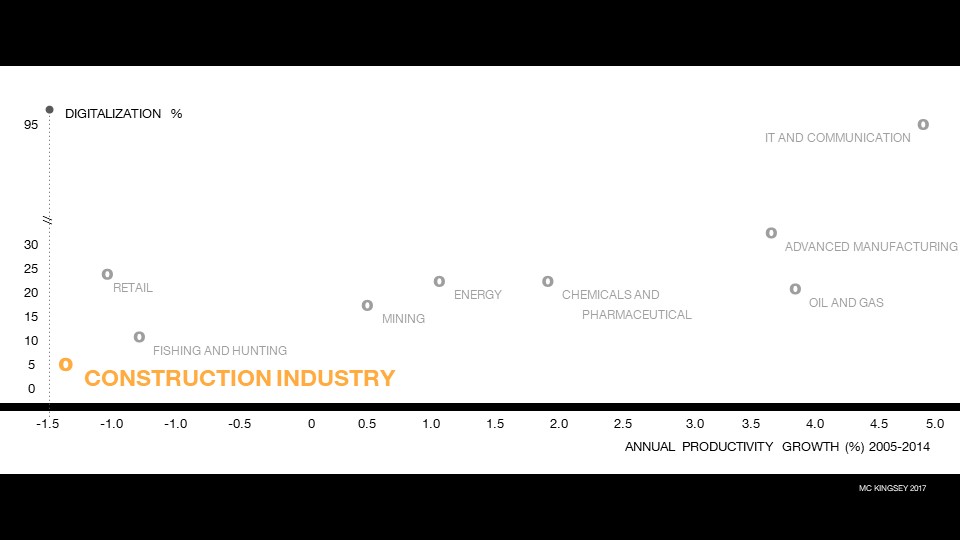 We have thought about how to digitize all the various simple house data and how A.I can use these data for future users. In fact, according to the graph (MC Kingsey 2017), despite of high percentage of productivity and digitization values in the industry field, the construction industry field has the lowest values compared to others. This graph represents well that how the productivity is increasing with digitization.
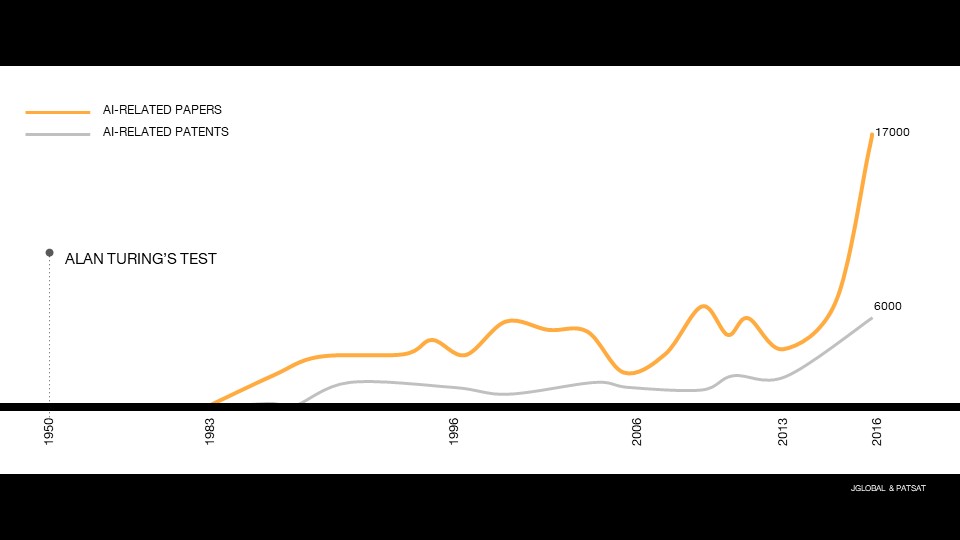
In parallel, we see that many fields have started to use A.I for their data. In this graph(JGLOBAL & PATSAT), we can notice that a high number of papers were published in recent years, but also, AI-related patents have also developed with high value.
OBJECTIVE
The aim of this project is to tackle the world demand for houses, providing a tool for affordable, sustainable and functional prefabricated houses. We have therefore posed a question below;
Can we use AI to predict the best suited prefabricated simple house solution to meet the needs of users?
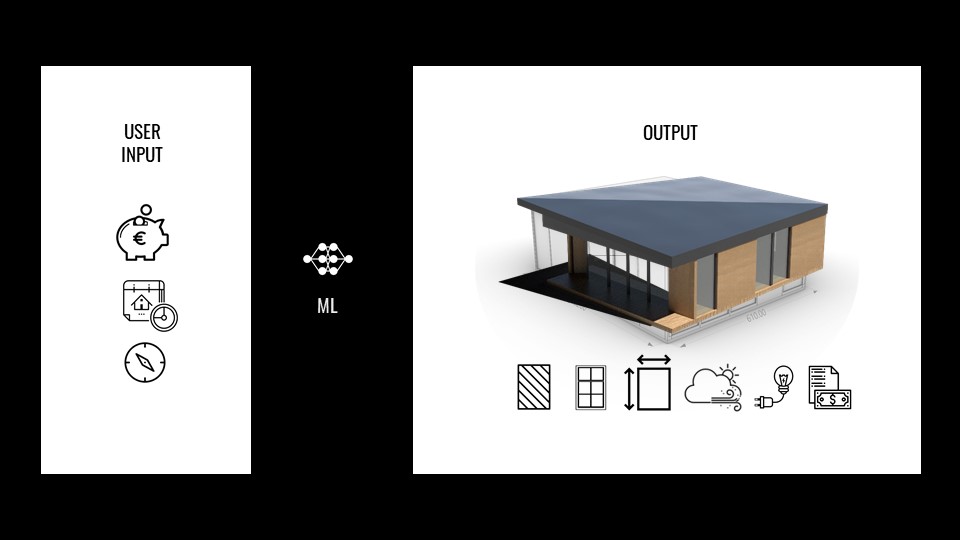
Can we predict a house for buying a house from certain inputs from a user for instance a construction cost, time and orientation of house?
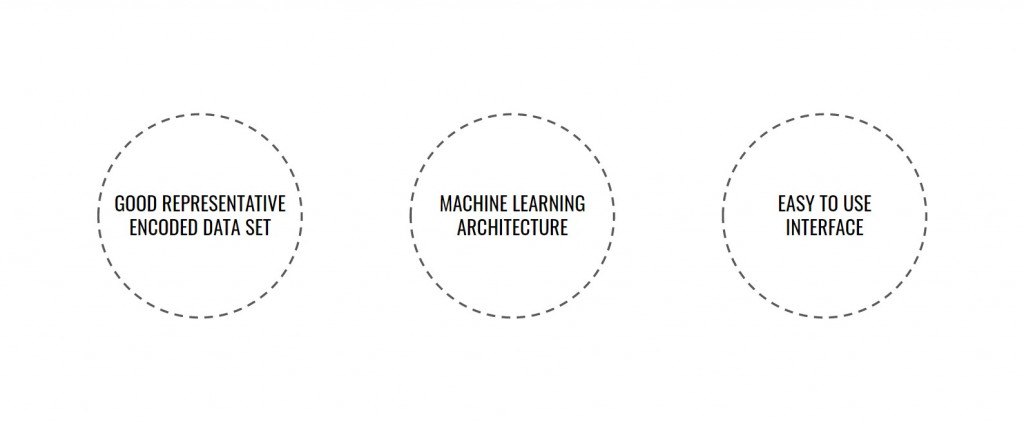
In this project, we used a supervised learning with created data from Rhino. Grasshopper. After many times of test to train machine learning and predict new geometry, we found out that the only a good quality and quantity prepared datasets could result(predict) a correct geometry that would generate easy interface for user.
CREATING & ENCODING DATASETS
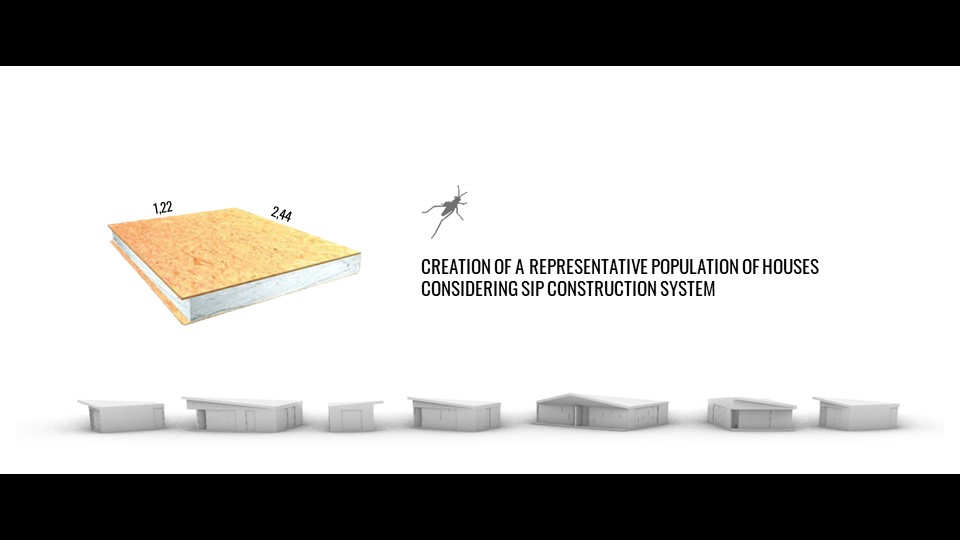
Before we made a data set for machine learning, we made a catalog of 46 houses composed of SIP(double faced OSB with insulation in between). The houses are varied based on a panel size of 1.22 meter of weight and 2.44 meter of height.
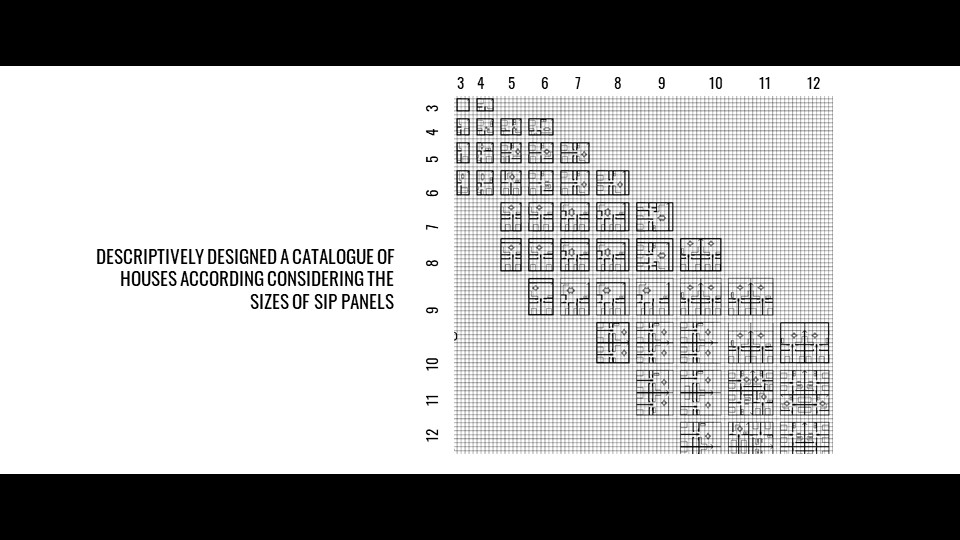
The 46 interior plans from our plan generator are accurate, functional and efficient in panel distribution without losing material.
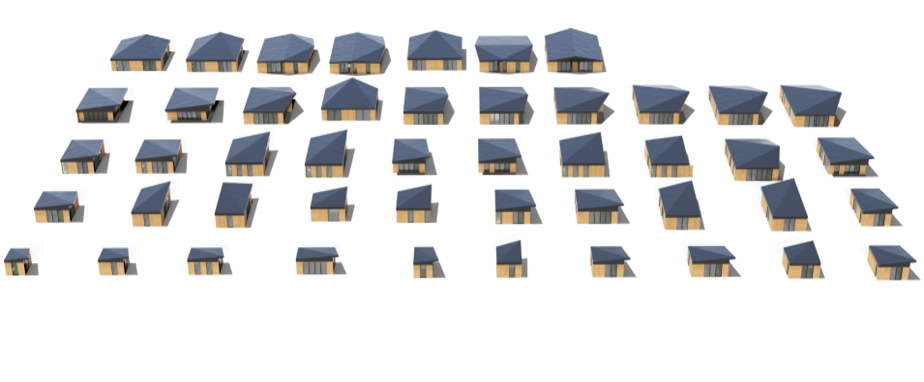
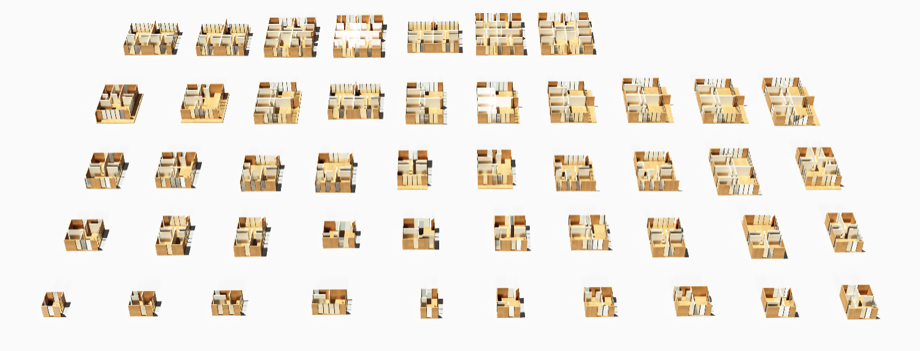
The 46 houses variations.
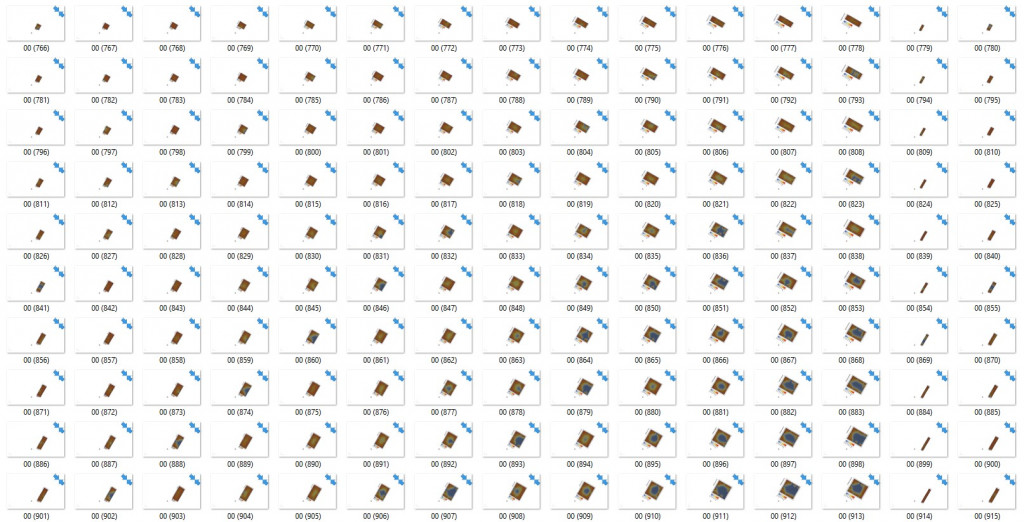
 Each house and its variation was analysed and saved data for energy and daylight autonomy for the prediction, changing the rotation and position of the house in 360 degrees on each 10 degree.
As first data a set is created with the epw.file(environmental data) of the site of Ile-de-france.
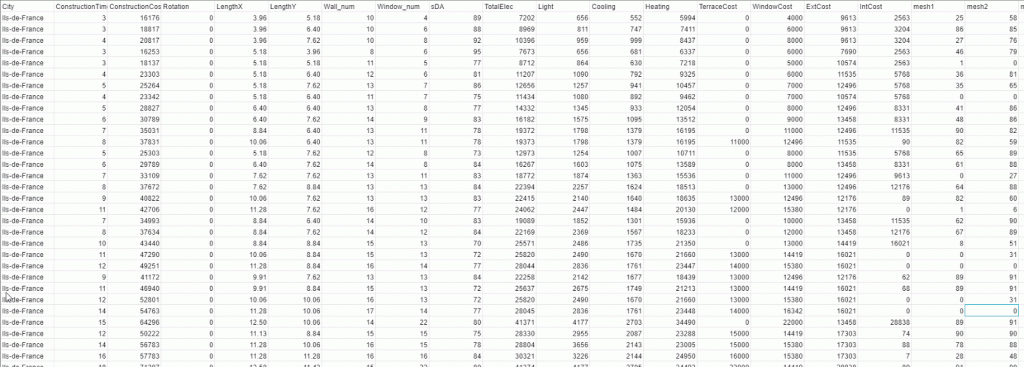
THE DATA SET HAS NOW 1655 SAMPLES, AND CONTAINS 77 FEATURES. THEIR ARE ALL RUNNING CONSIDERING THAT THE LOCATION IS IN Ile-de-France. ONE OF THE NEXT STEPS SHOULD BE CREATING DATASETS FOR DIFFERENT CITIES.
MACHINE LEARNING
-
DATA ANALYSIS
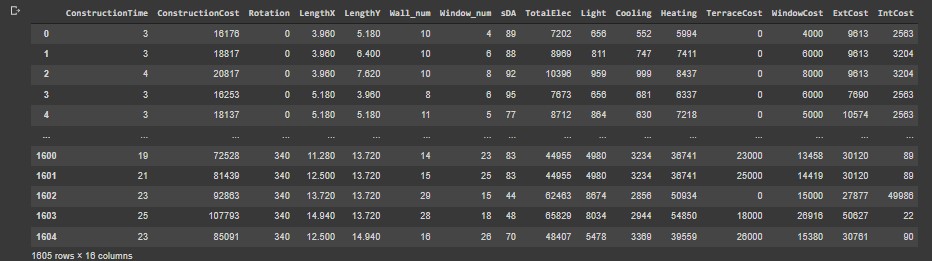
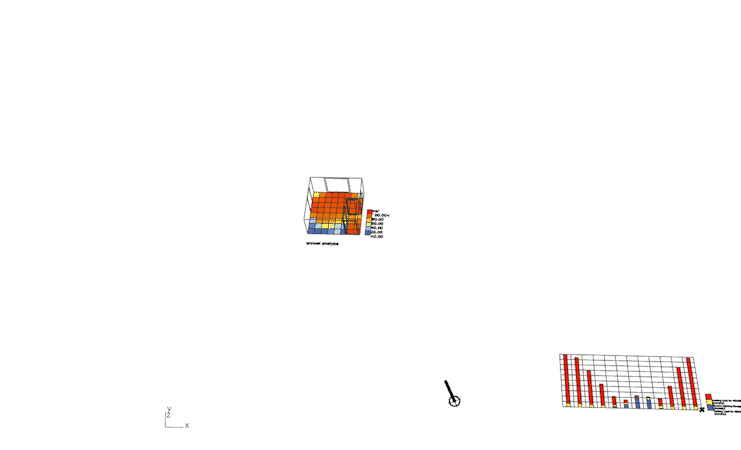
We have 1605 data and 16 columns. Except of meshed color map data of daylight autonomy, we have principal 16 columns.
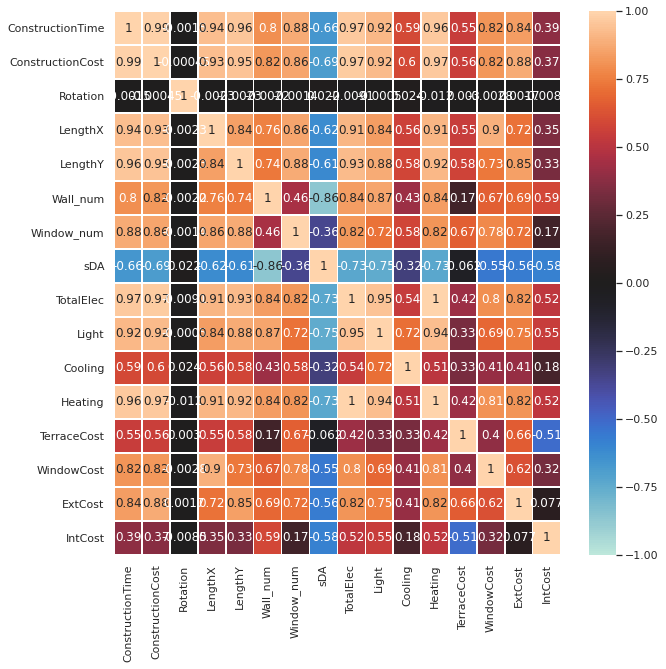
Thanks to the heat map plot, we see that the construction time and cost are highly related with other features. Rotation isn’t relate a lot with other features but we may need it for user interface later.
2. PCA Analysis
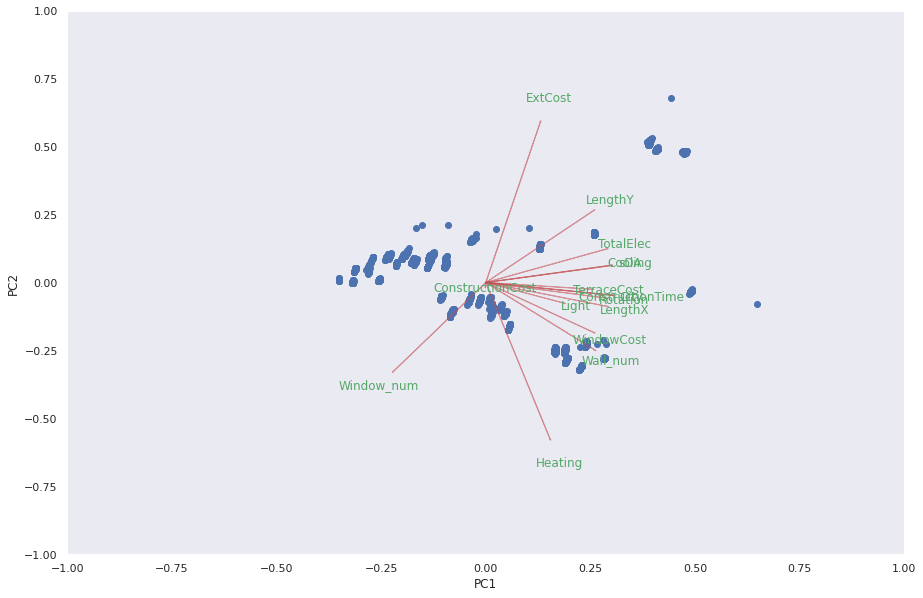
After analyzing the data, the Principal Component Analysis was done in order to understand better a correlation. This is a technique for reducing the dimensionality of dataset, increasing interpretability but at the same time minimizing information loss. The length of the arrow represents how much that variable explains the variance of the data. A small angle indicates that the representation of the two variable are positively correlated. And angle of 90 degrees indicates no correlation. An angle of 180 degrees indicates a negative correlation. Therefore, according to this graph, the window numbers and the wall numbers has no correlation. Exterior cost, length Y and total electricity consumption has a negative correlation. But also, at the index of the most important feature on EACH component, we see that the construction time and construction cost are highly correlated with other components.
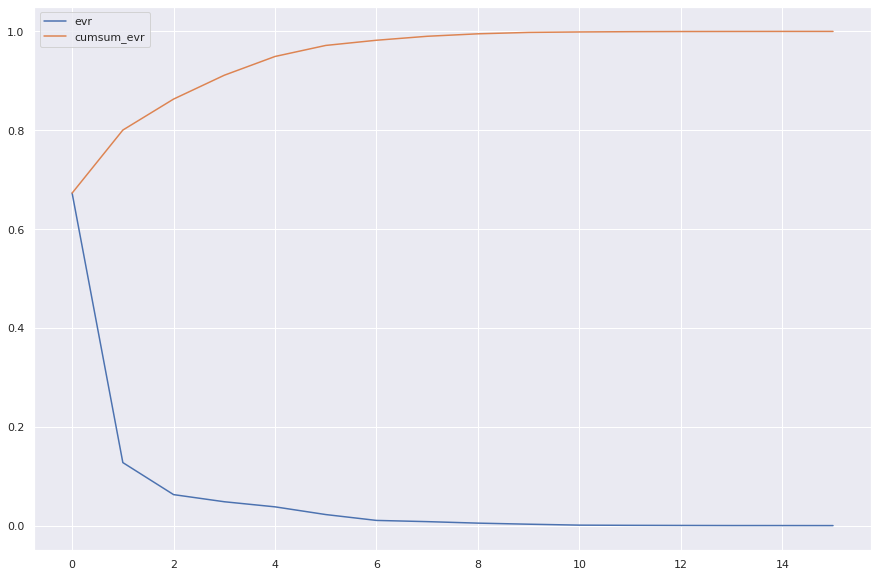 This mat-plot explains that PC1 has about 70% of the variance then PC2 has about 80 % and 90% for PC4.
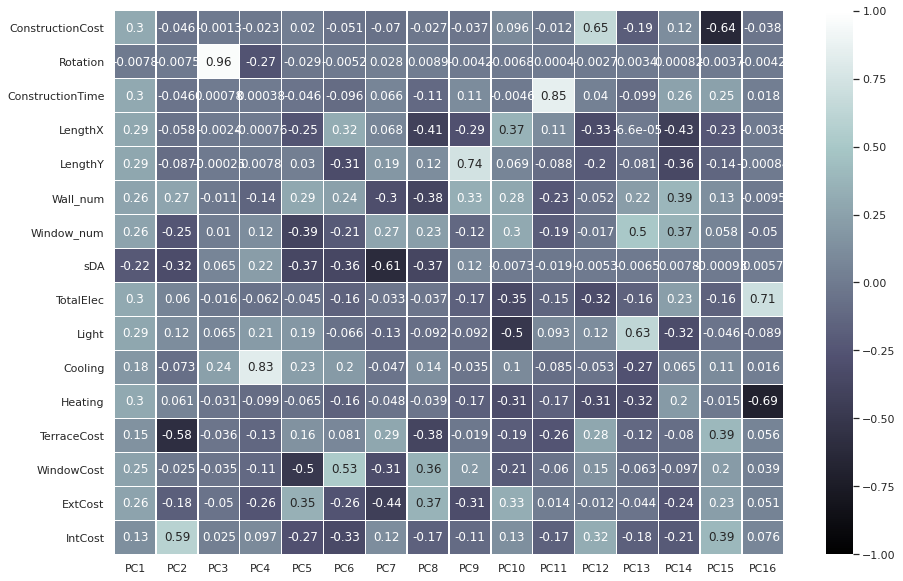
At the heat map of PCA Here, we found that PC3 which is Light electricity consumption has high corelation with rotation value.
3.ARTIFICIAL NEURAL NETWORK
 (source :
http://alexlenail.me/NN-SVG/index.html)
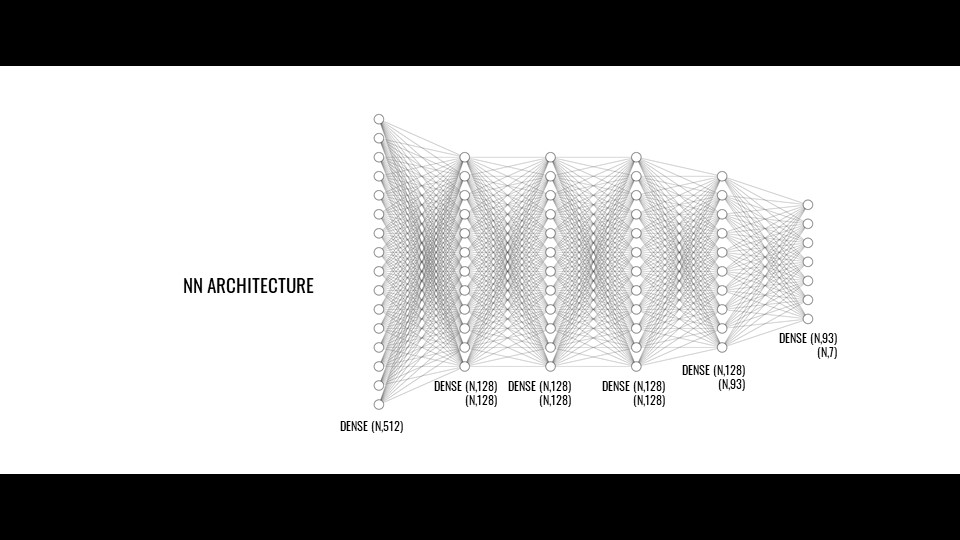
For A.I system, linear regression and artificial neural network and they had a similar result. So that we decide to use the neural network architecture for machine learning in order to test with more complex layers. At the last test model, we get a relatively good result with 5 dense layers of 512,128 and 93 neurons. Then for the output dense layer, we have 7 neurons with linear activation since this is a regression structure. For compiling, ‘adam’ was used as an optimizer and ‘mean_squared_error’ was used for loss function.
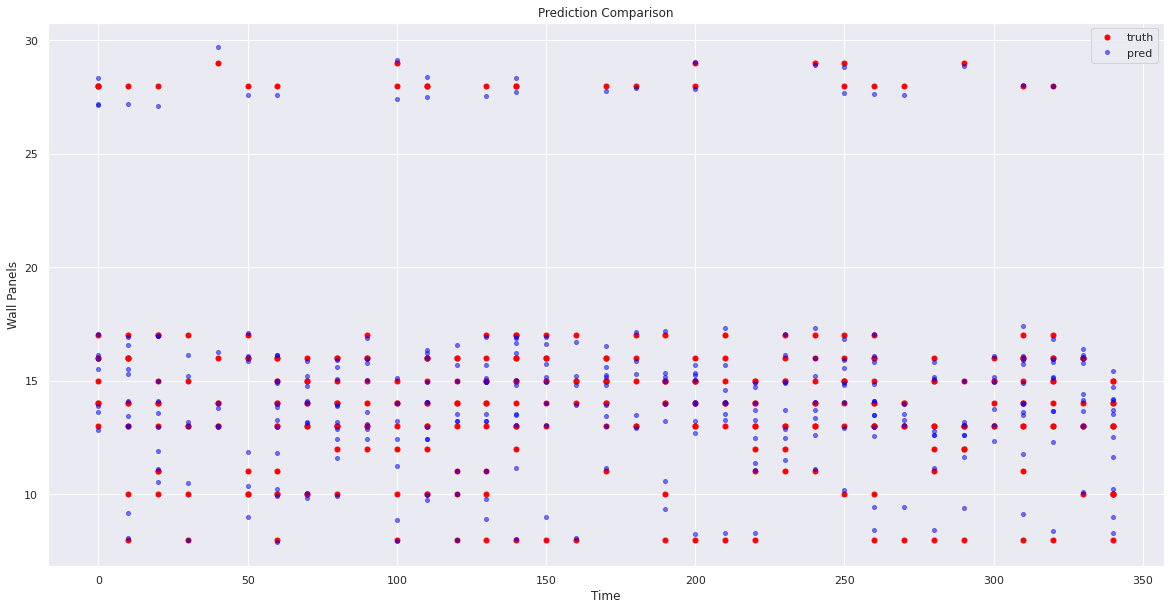
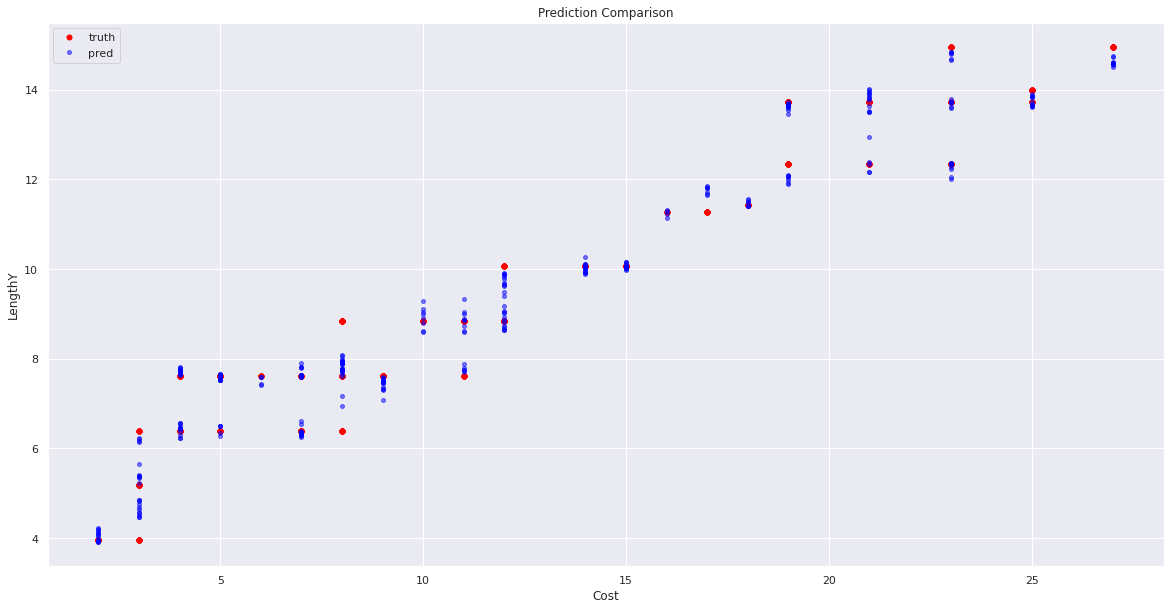
PLOT ERROR CHECK VIA CHART
Through a plot error chart, we can compare prediction and truth value that we trained.
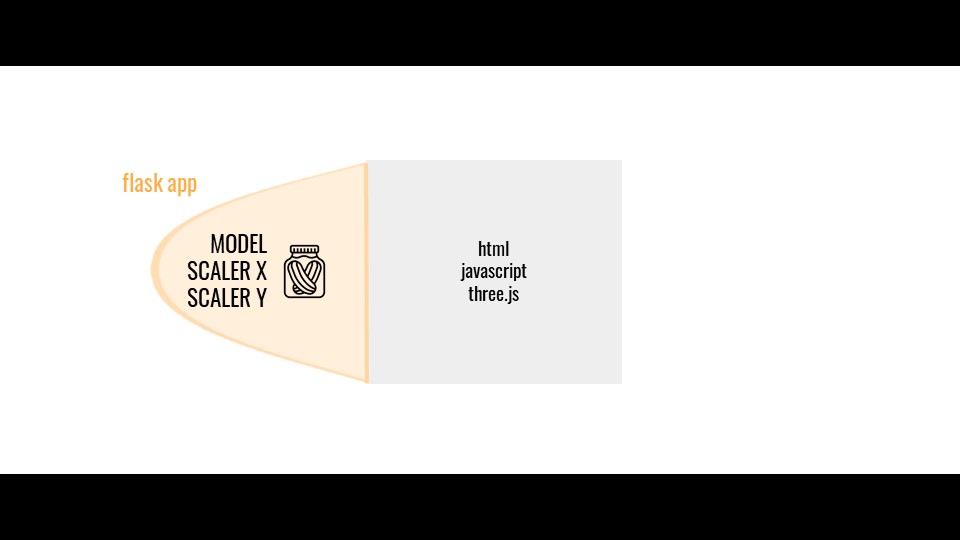
USER INTERFACE & BACK END
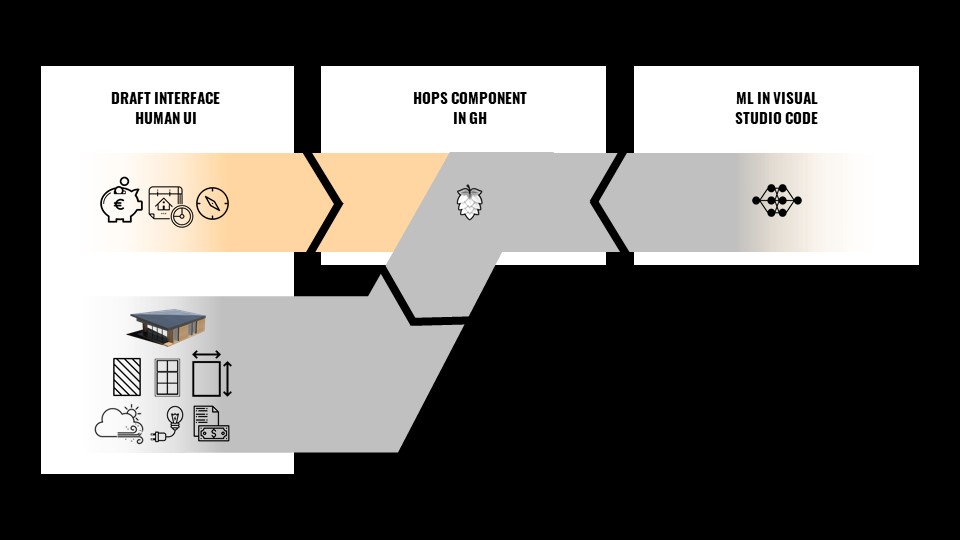
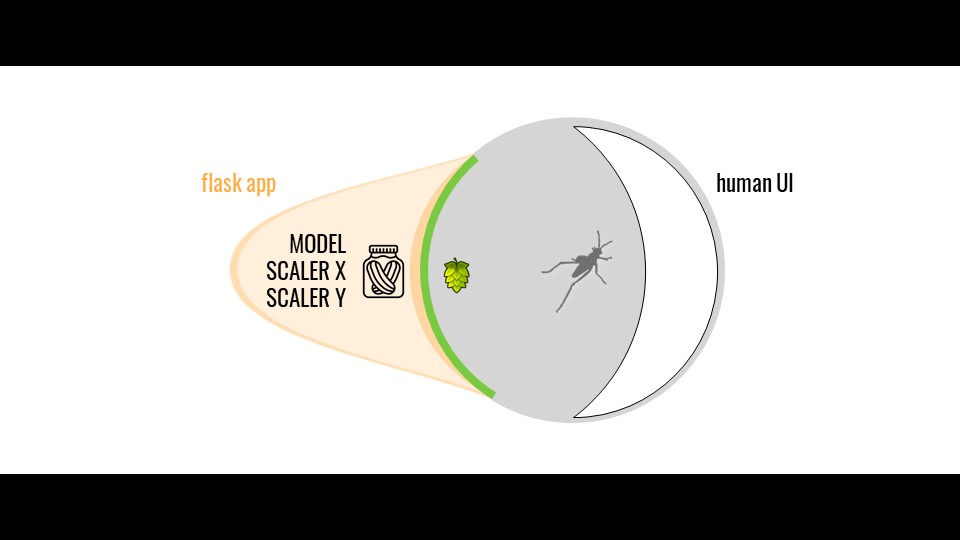
After predicting output values, we use this number data in Grasshopper environment by using the ‘Hops‘ component. The Hops creates connections between Grasshopper and other languages. In our case, ‘Pickles’ files which is scaled X and Y data of our machine learning model, and ‘h5’ file which is our neural network architecture data.

PREDICTION DATA FOR GENERATING GEOMETRY
The image above is the test version of predicted data in grasshopper to predict geometry which is house based on input data of construction cost, time and rotation angle.
Hops requires a flask app and we use it in Visual Studio, where we add the ‘h5’ file, and the dimension scaled data, pickle file. The User Interface Was Then Created With ‘Human UI’ tool as prototype of this tool.
WEB INTERFACE
After our prototype for a custom user interface with a Grasshopper component, we made a real web page for the next step. As you can see on the video above, user can input their prefer price and orientation of house and surface at the ‘Explore AI Solutions menu’. Construction time would be added in near future.
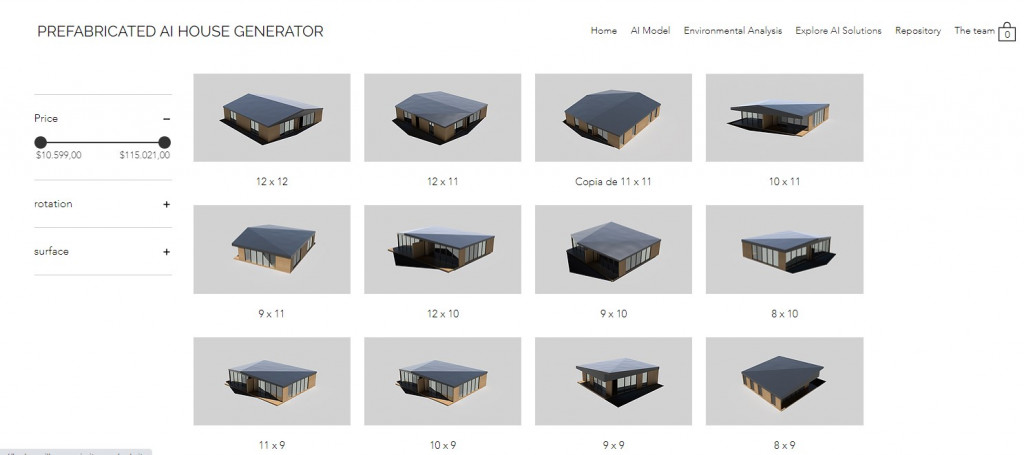

Then user can click a proposed houses from our machine learning predicted data, they see more detail information of the prefab house. Our previous Human-UI user interface would be combine into this web page.
CONCLUSION & NEXT STEP
After this project, we found out a big possibility for an architect who works generally in front-end way from design analysis to construction planning and cost. They can store all their design as a big data by our method in a dateset that is used for a back-end development for a user centered interface in our site. It would be interesting to scale up a habitat with several floors in city scale. Generating plan can be also studied with an other method of recursion and subdivision by coding.
For future development and understand deeper how it works, we share all our code and files on Github. Here
