Research Objectives
Topic: Using the object detection algorithm for architecture
Computer vision for object detection plays an important role in the era of computation and Artificial Intelligence, its wide application varies from the automotive industry in self-driving cars to the health industry for the detection of diseases. In the case of Architecture and Design, its potential application could vary from the detection of structural flaws to people’s movement.
The aim of this project is to explore the application of Convolutional Neural Networks to detect multiple objects in architectural house facades using You Only Look Once (YOLO) V5 algorithm. The CNN algorithm was trained to detect three different categories of elements: volume (house), void (window), and texture (vegetation), from a dataset of more than 100 photographs of house facades.
What is object detection ?
Before understand the object detection, we should understand a technique of the object localisation. This two technique is a part of image classification. We are going to see with an example of house and tree image below.
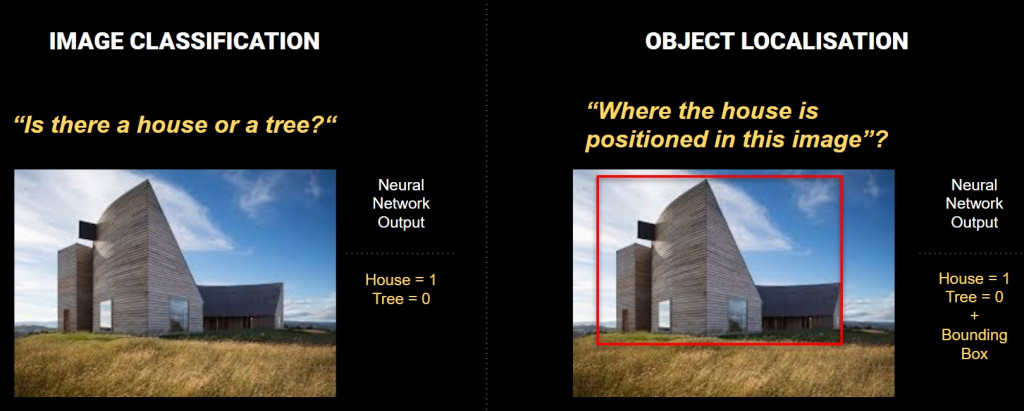
At the simple image classification, if a image have a house, neural network say that house is equal 1. If there isn’t a tree, it is equal 0. At the object localisation, it gives us an information of object but also tells us with a bounding box which is a position of the object within the image.
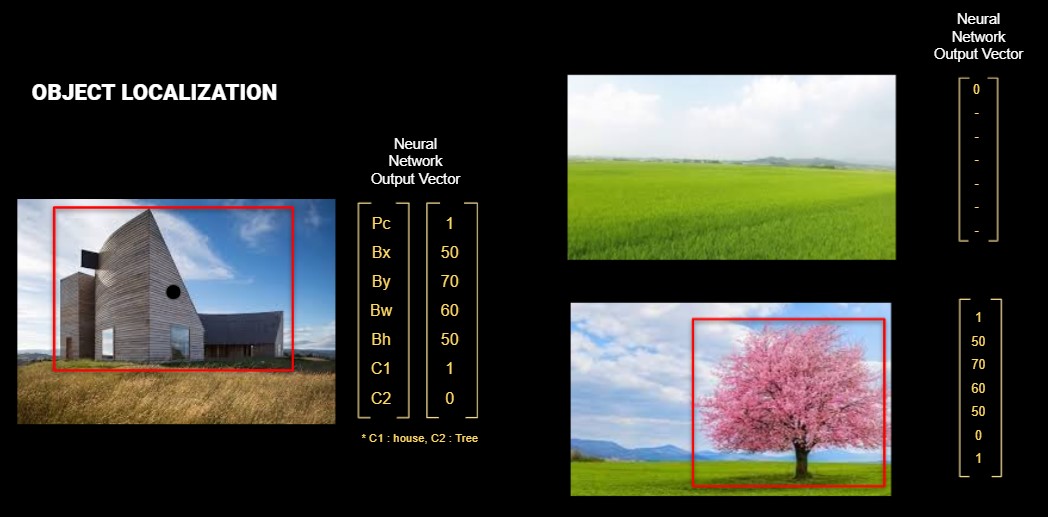
At the Object localization, neural network creates 7 output vectors.
Pc: Probability of a class. If there is a tree or house, it is 1. If there isn’t, it is 0. Bx and By are coordinate of the center point of the box. Bw and Bh are size of the box.
C signify a class. C1 is house and C 2 is tree. If there is no house and there is a tree, it is 0 and 1. But this object localization is for a single object at a image.
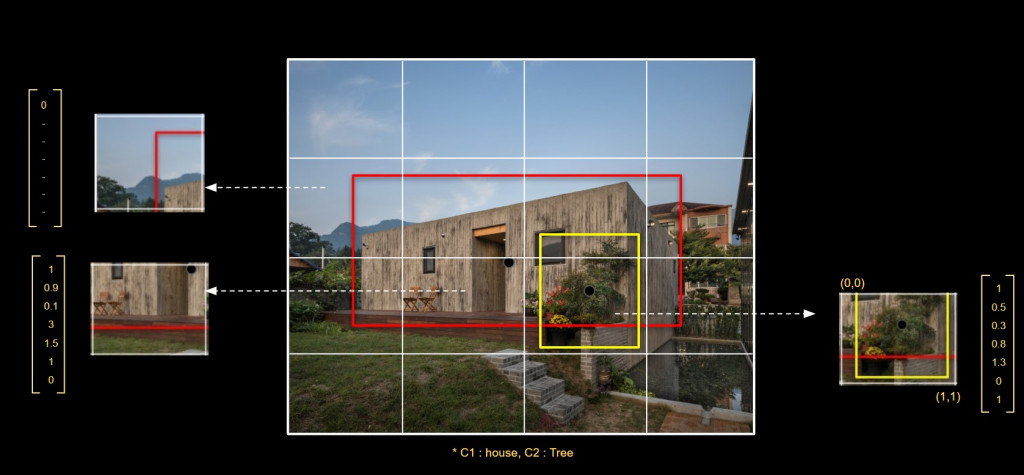
If there are multiple object to localize on an image, we use multiple object detection. As like the object localization, neural network creates 7 output vectors, but grid by grid. One image is divided by a grid 4 by 4 or 16 by 16 etc.. This example has 4 x 4 grid.
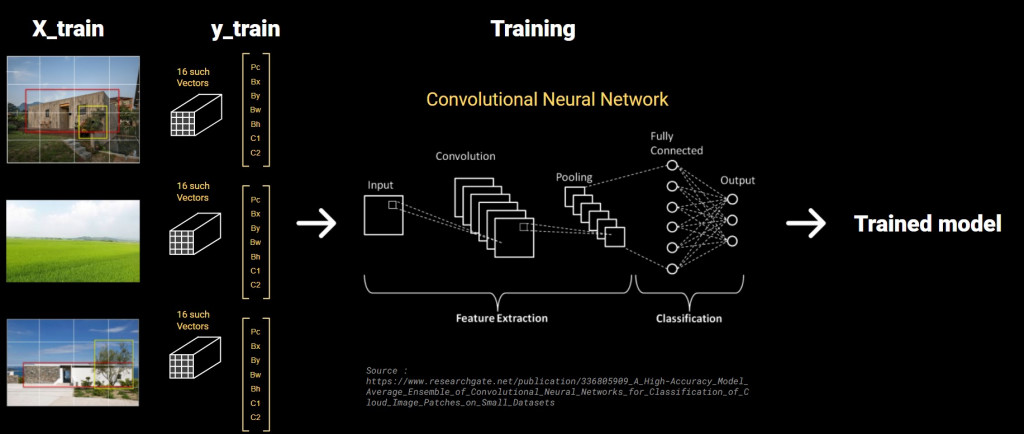
So each images will have 13 such vectors of its image, then this will train a model.
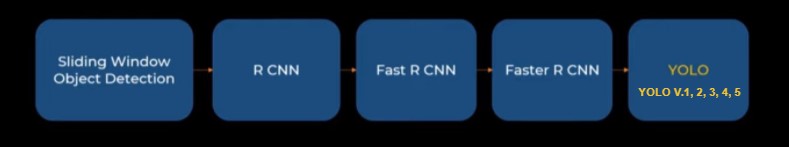
For the object detection, we have 5 methods, sliding window object detection, R-CNN, Fast R-CNN, Faster R-CNN and Yolo. 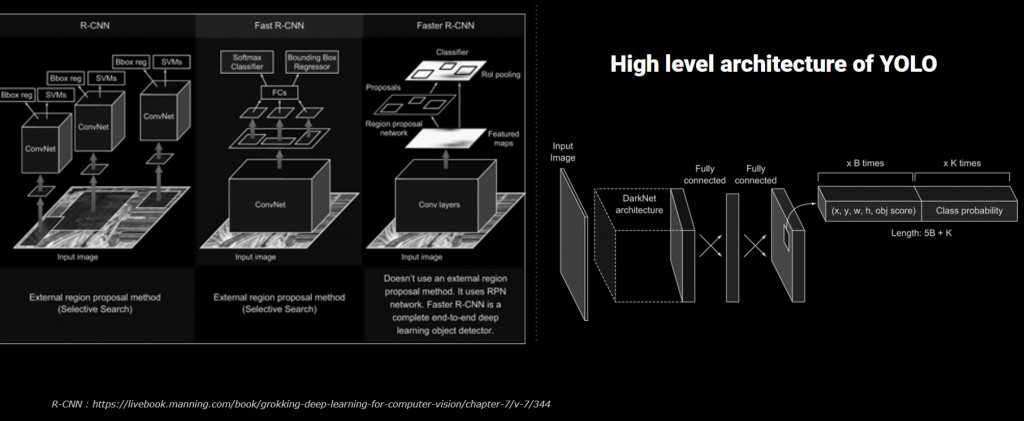
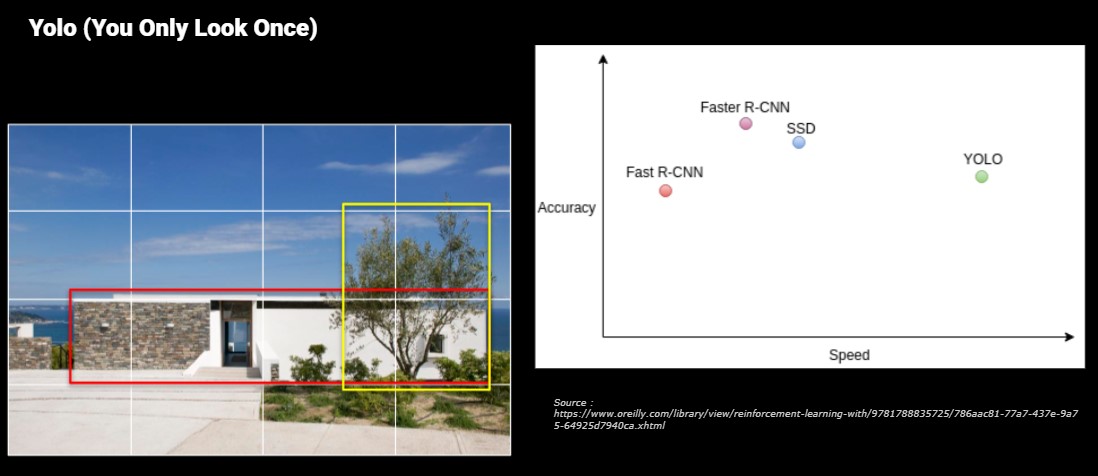
The R-CNN is used often to detect objects however, it has a big disadvantage of processing time. It is because, R-CNN use 2-stage detectors since they propose regions first and then perform classification and regression. So non-Yolo model send over thousands of divided images into the their model so that it takes more time. Fast R-CNN and Faster R-CNN improved the processing time, but it is still slower then Yolo. Yolo use ‘one-stage’ detectors, they perform predictions(classification & regression) directly from feature maps. Their method is to divide images in grids and each grid will predict a fixed amount of bounding boxes with confidence scores and class scores.This is why we call this Yolo , means “You only look once”
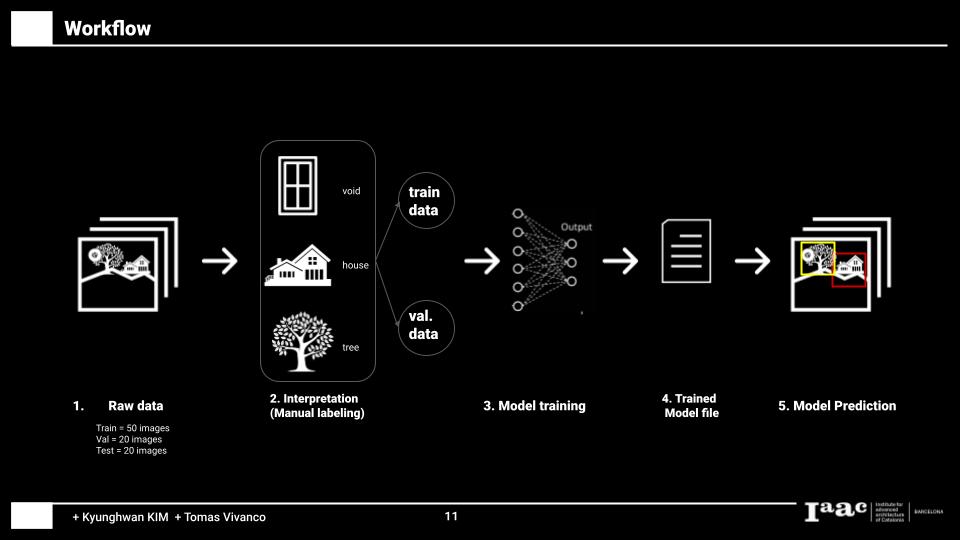
Workflow of project
Test Models comparison
Model 1
Epochs : 30 / Batches: default / Weights : yolo5s / Img size : 640
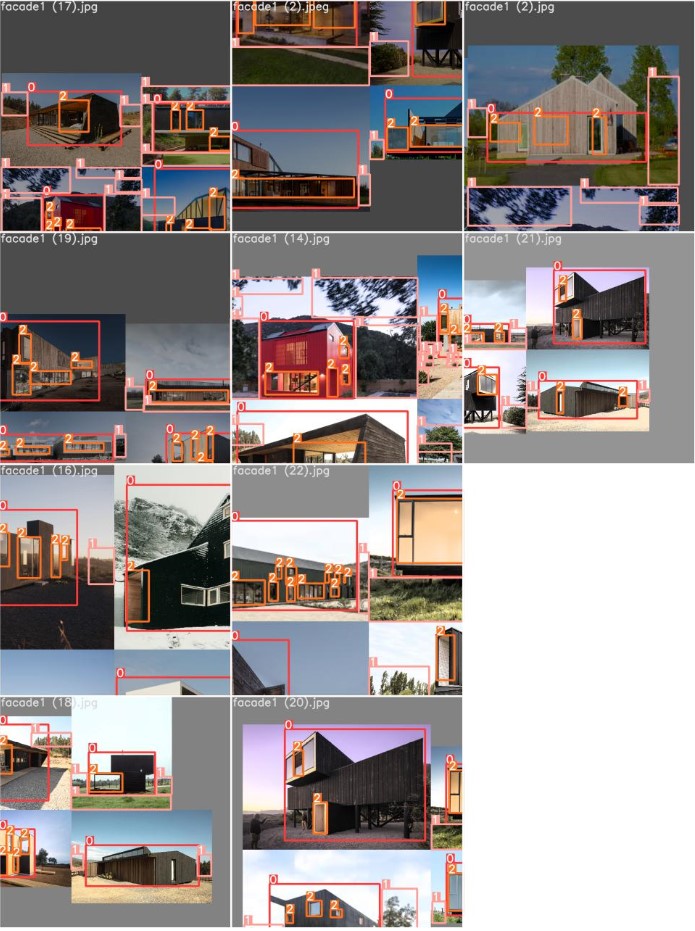
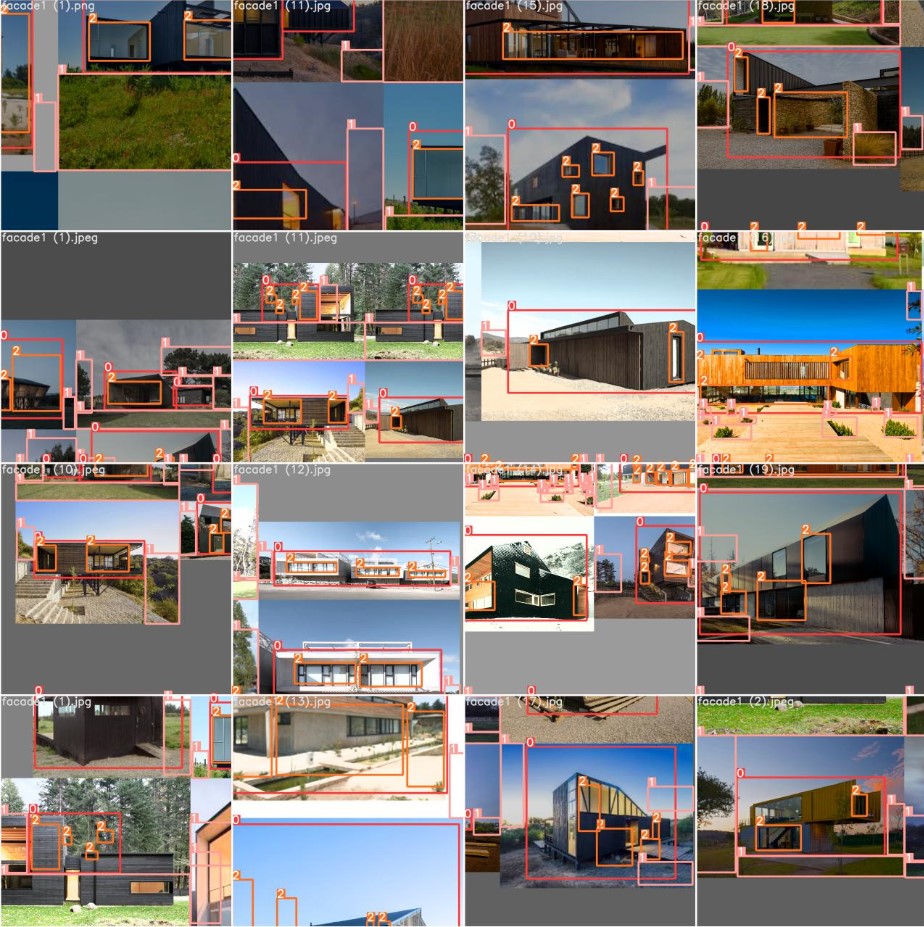 Train batch images
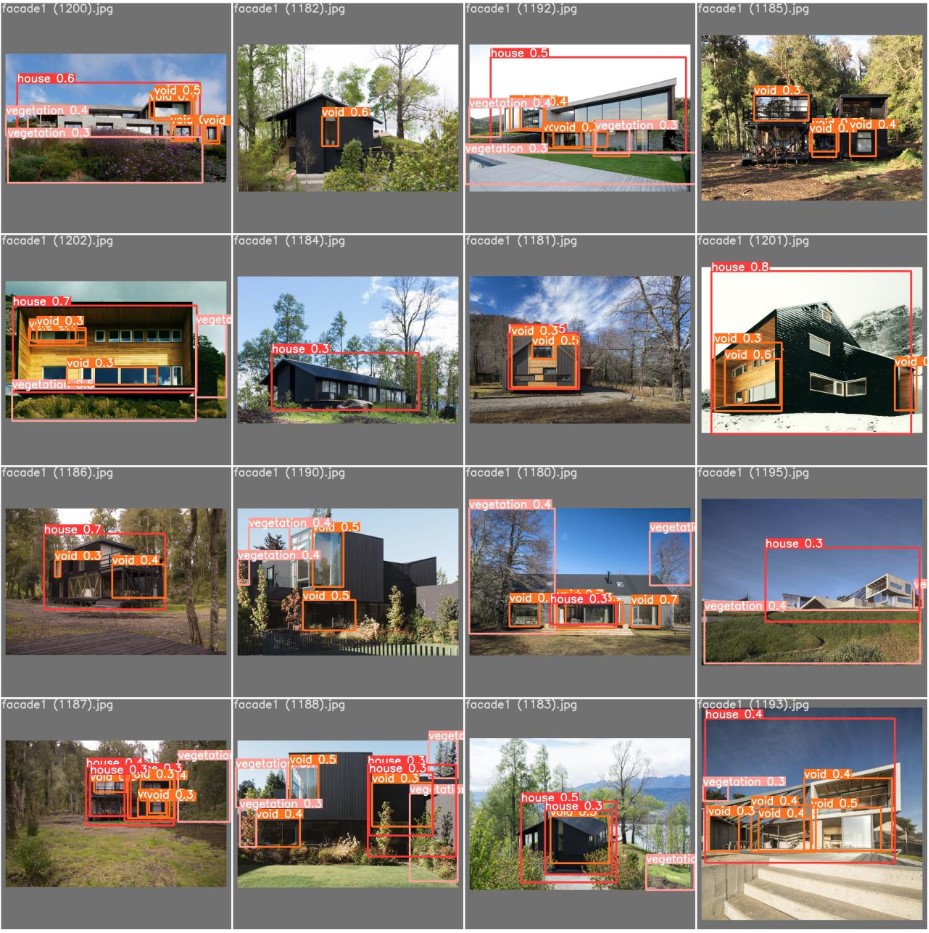
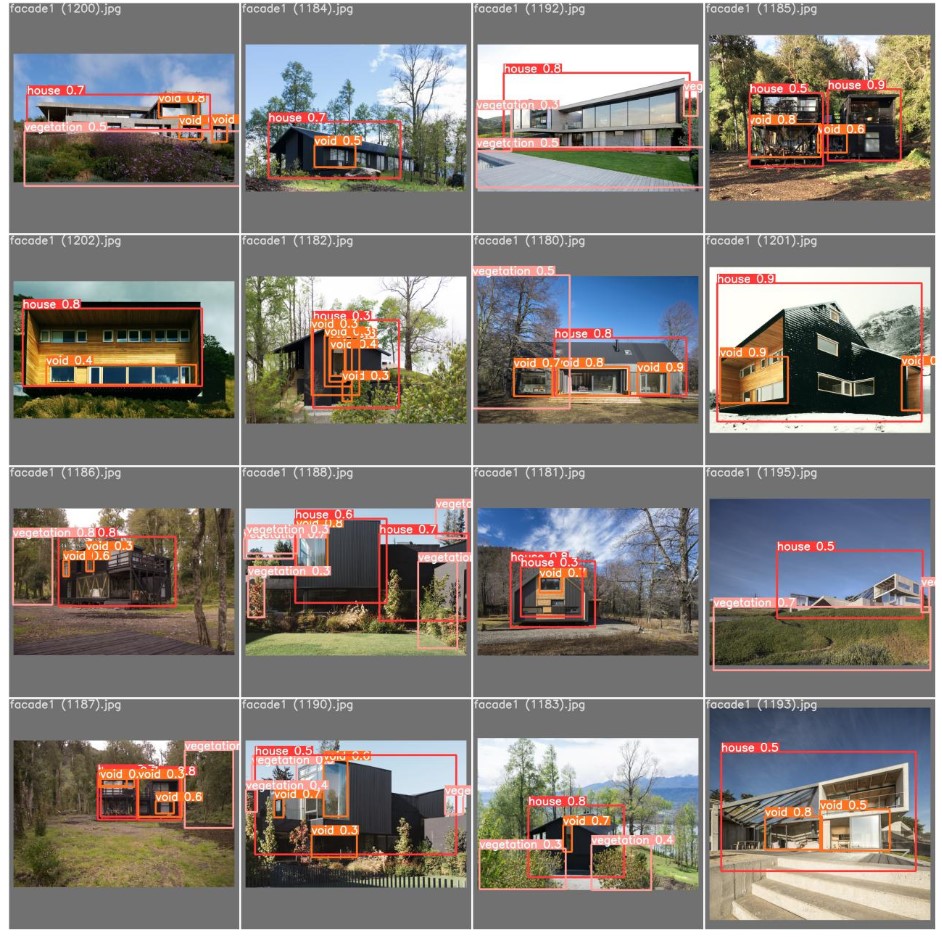
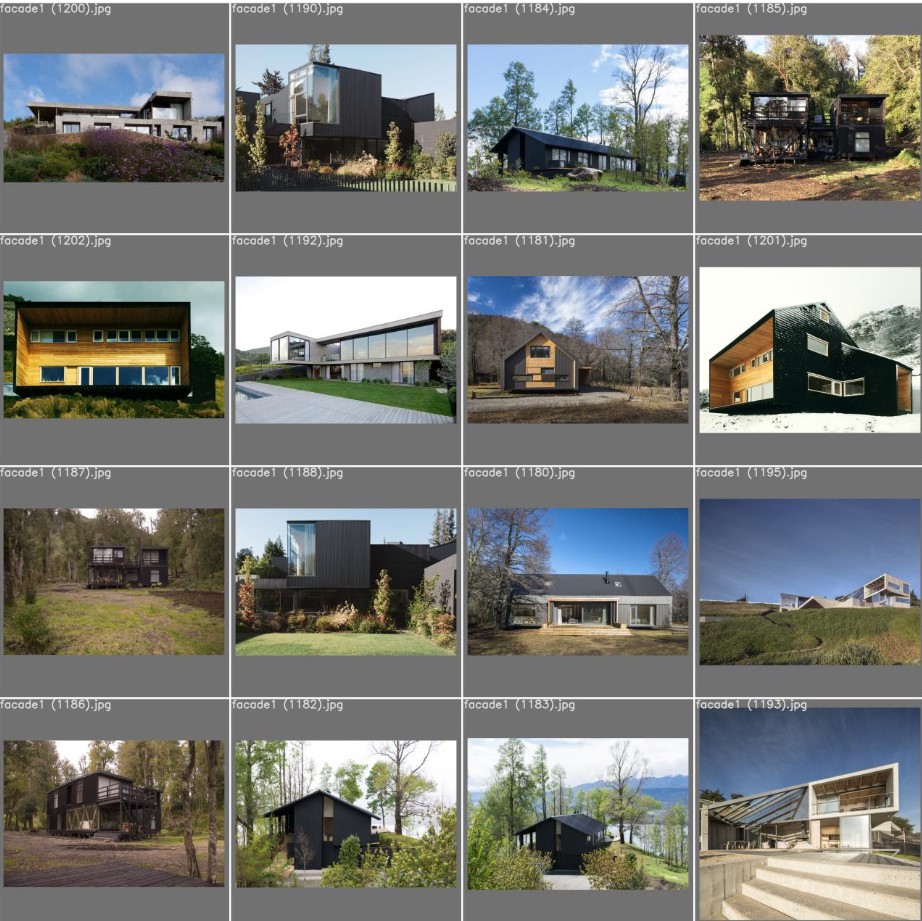 Test predicted images : result shown nothing with epoch value under 100.
Model 2
Epochs : 100 / Batches: 10 / Weights : yolo5s / Img size : 640
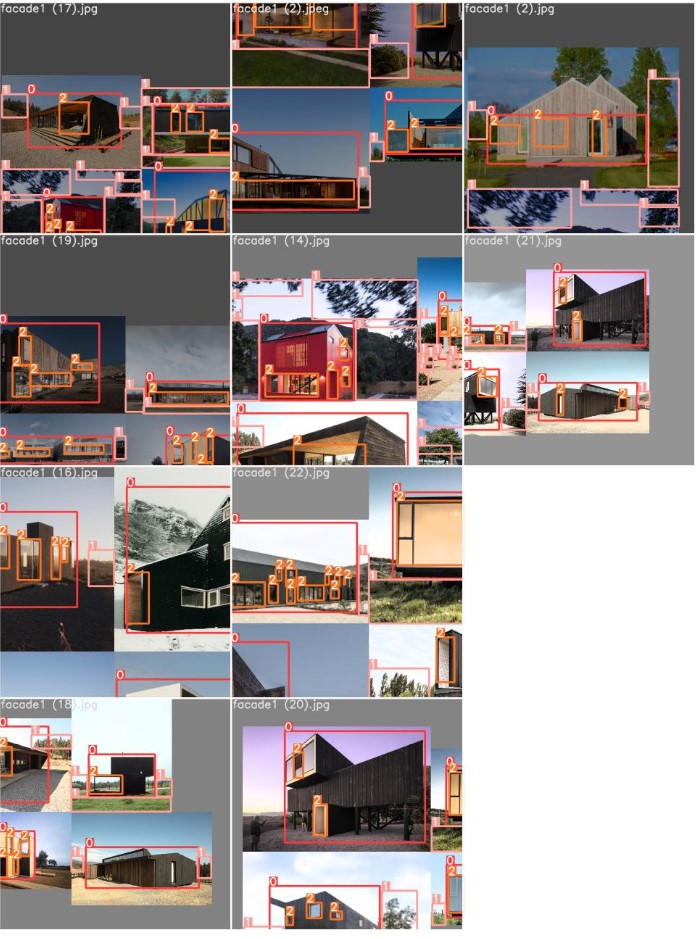
 Train batch images
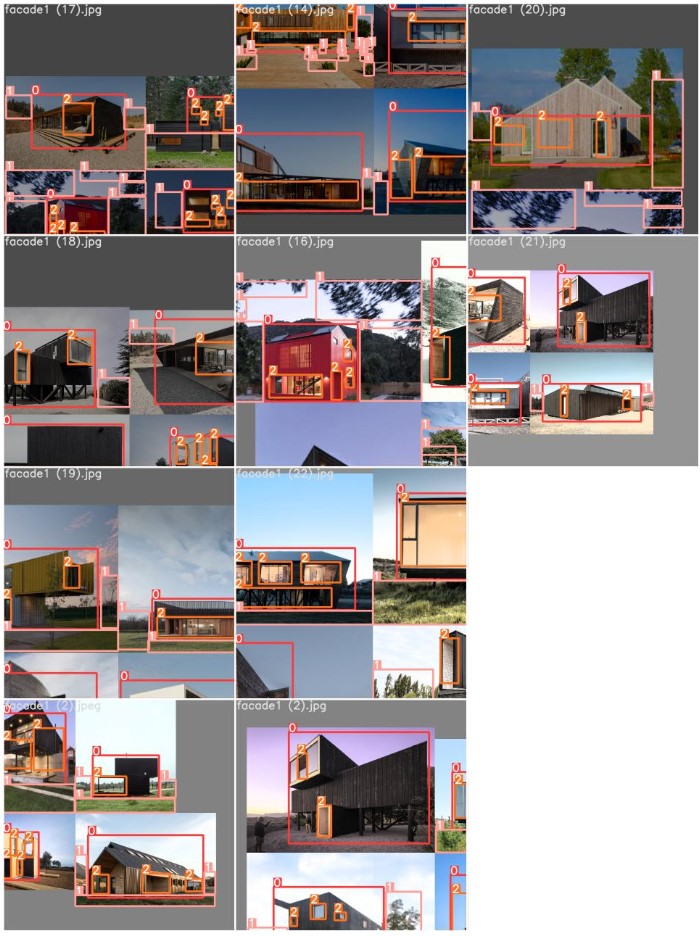
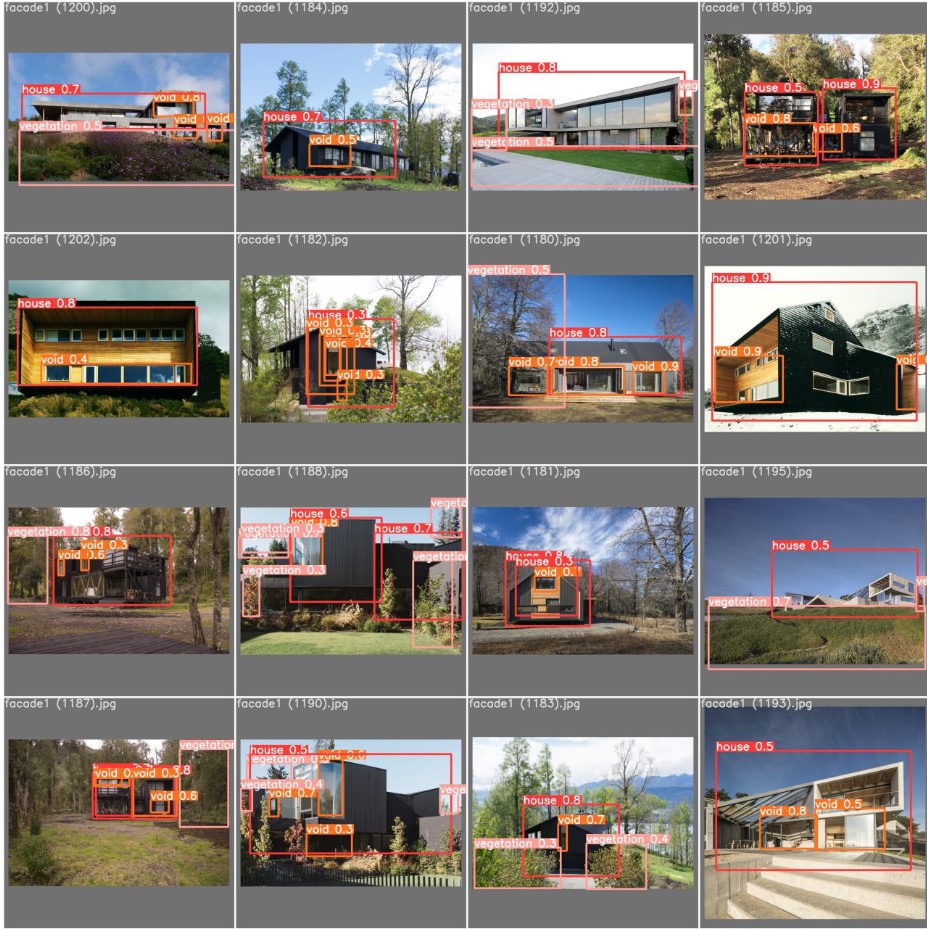
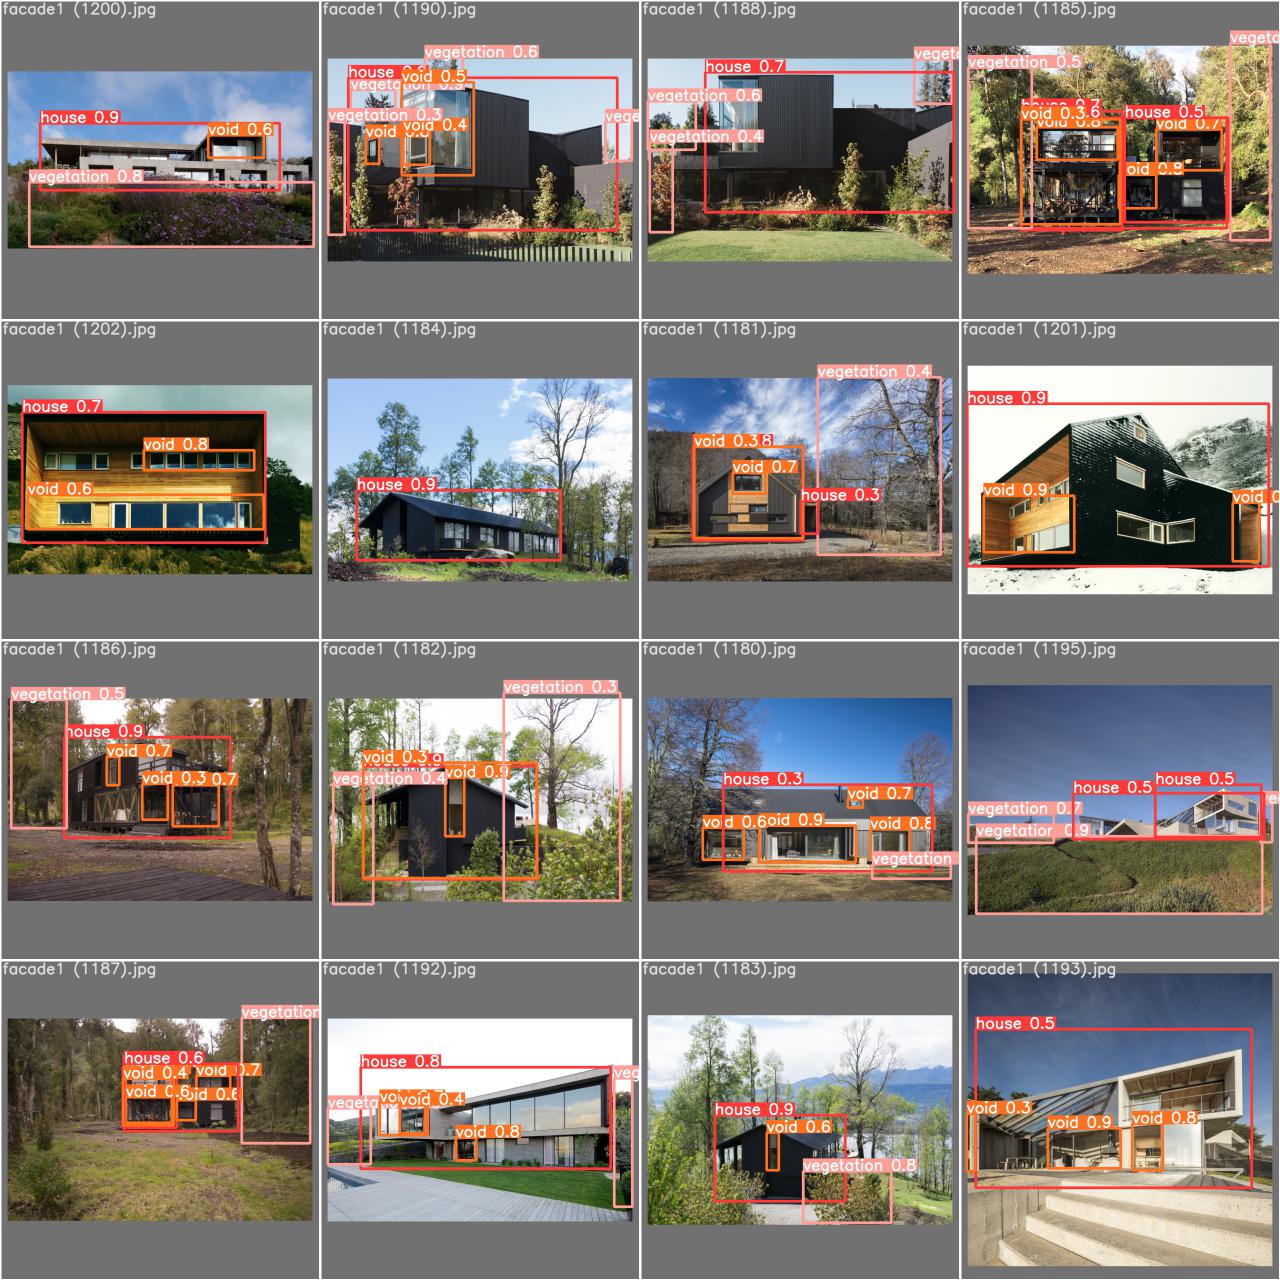
 Test predicted images
Model 3
Epochs : 200 / Batches: 10 / Weights : yolo5s/ Img size : 640
Model 4
Epochs : 300 / Batches: 10 / Weights : yolo5s / Img size : 640
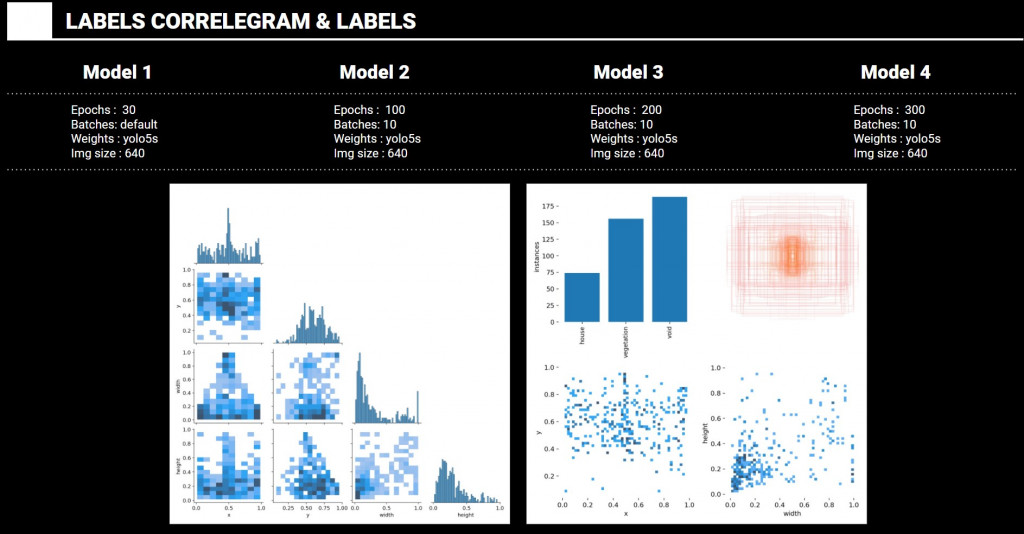
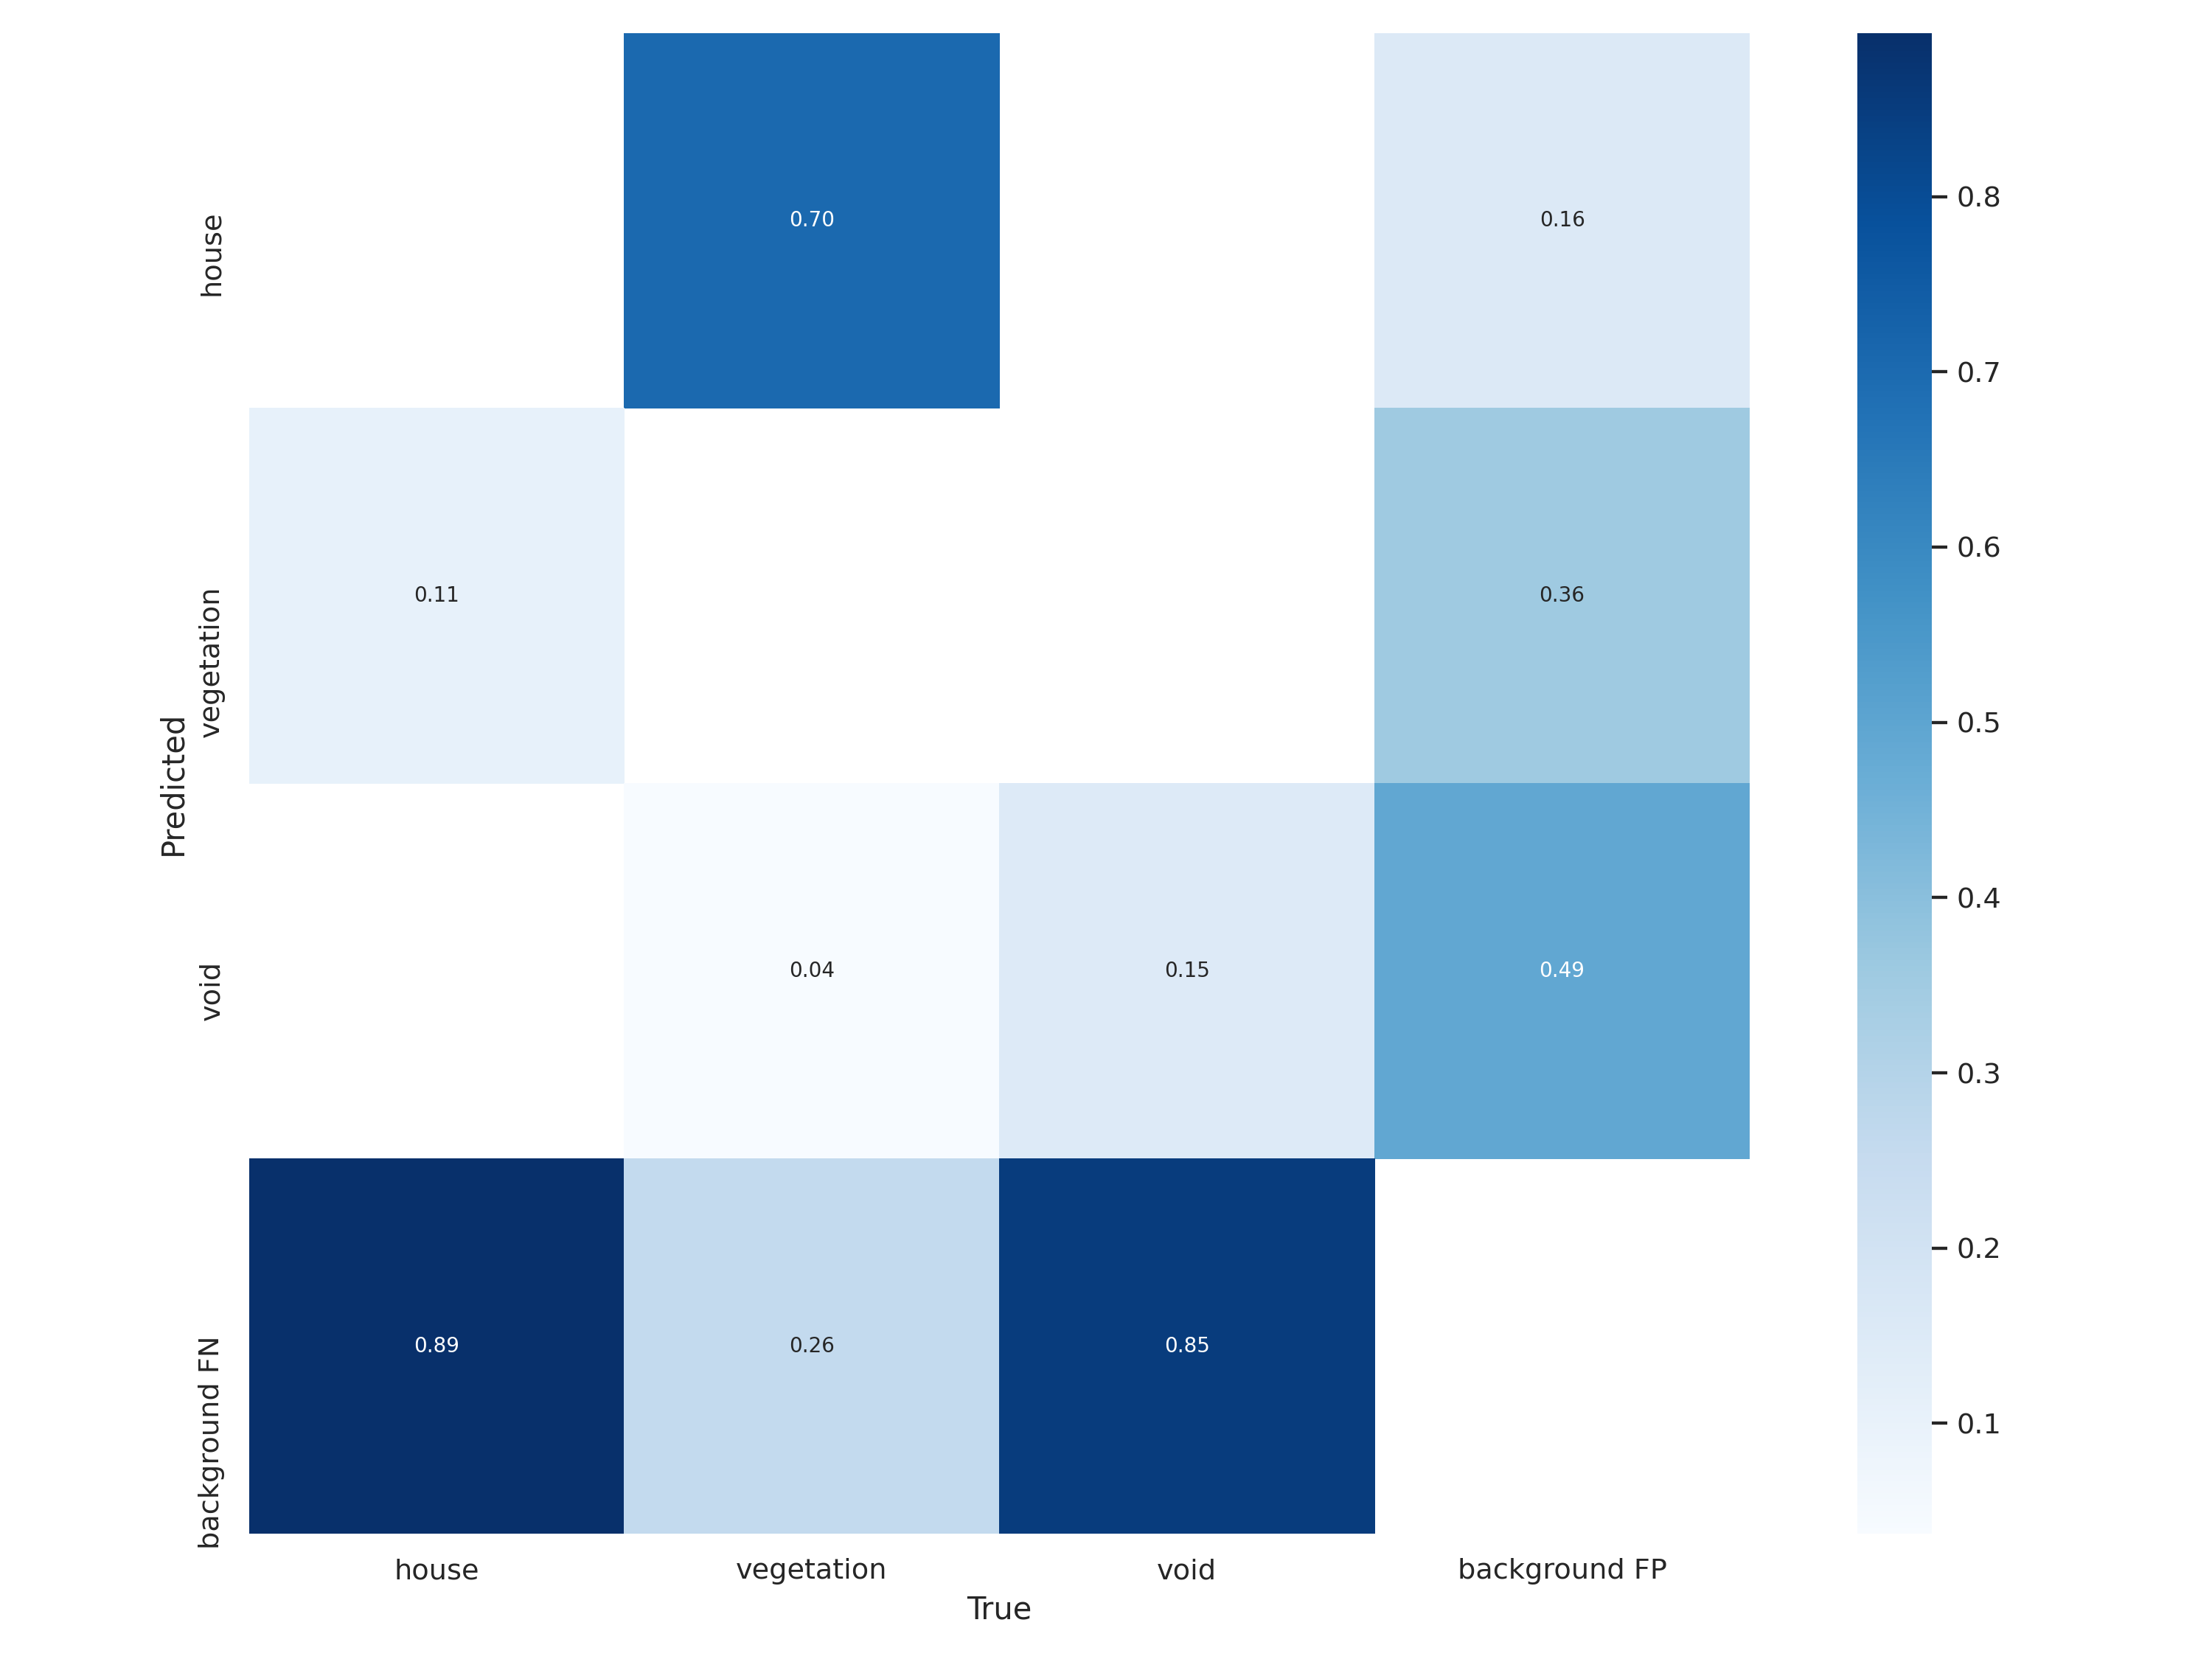
Confusion Matrix comparison
The left graph represent labels correlegram and the right graphs represents bounding boxes size and its instances by objects.
<Model 1>
<Model 2>
<Model 3>
<Model 4>
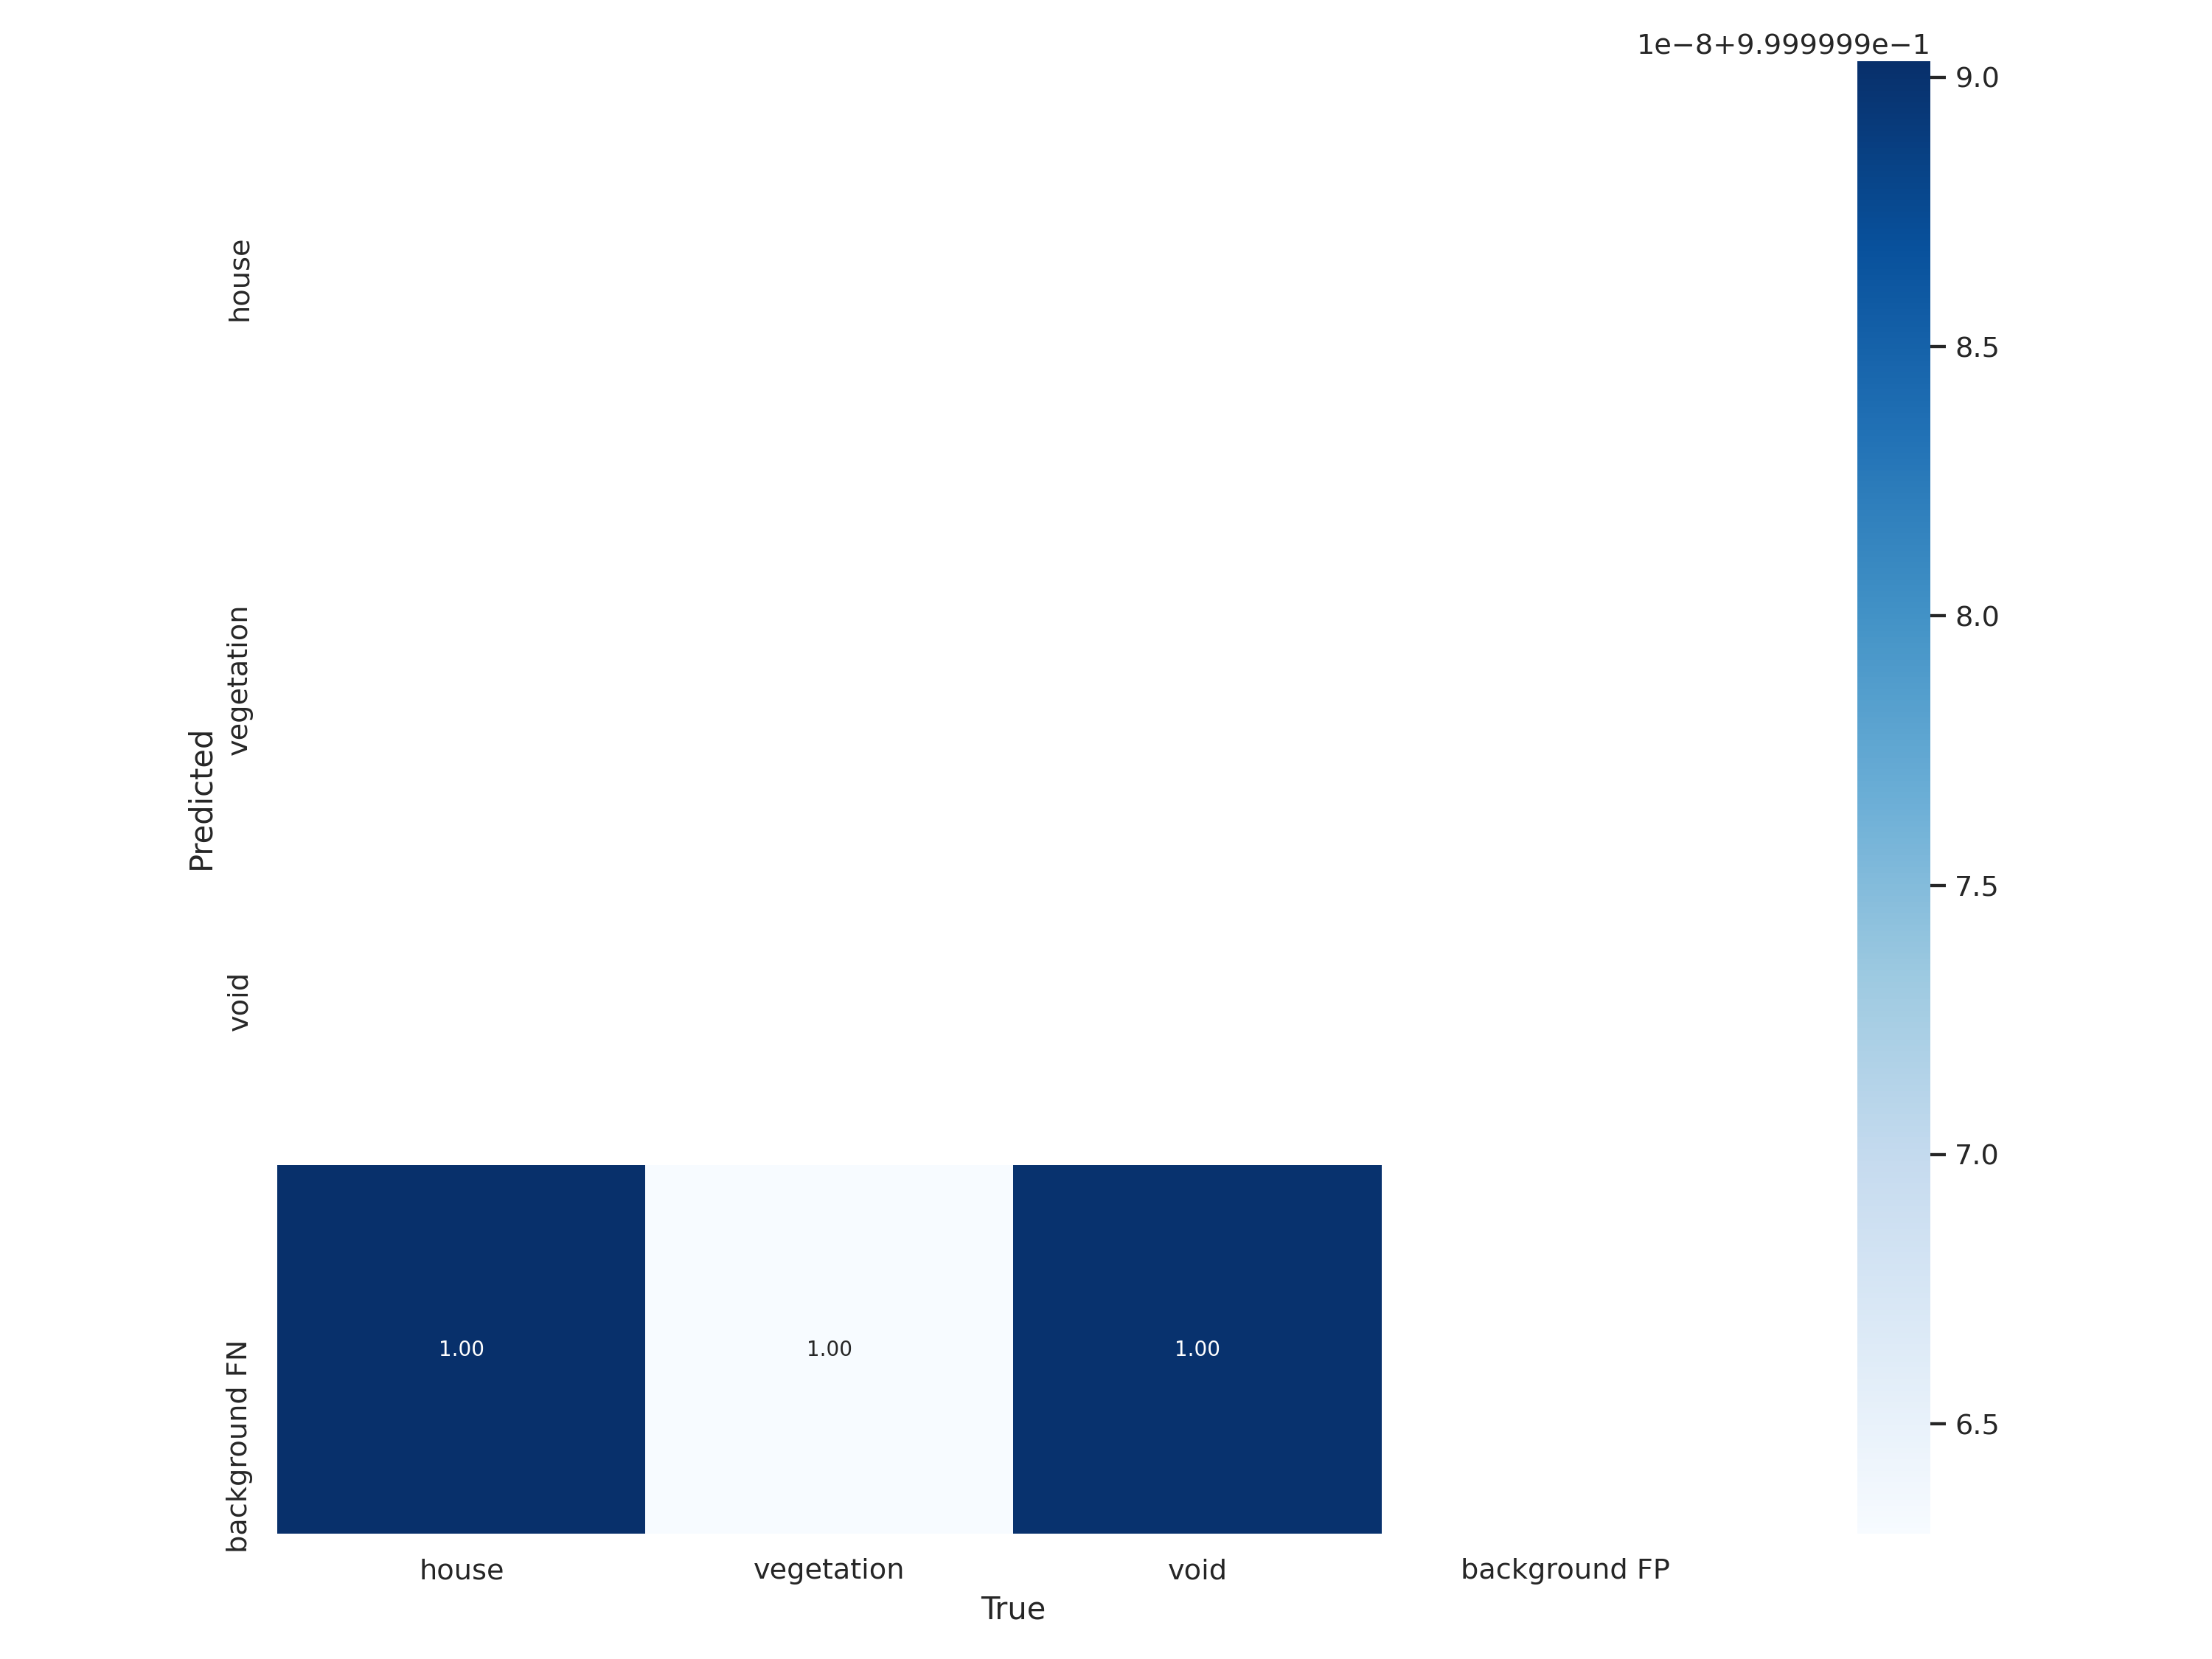
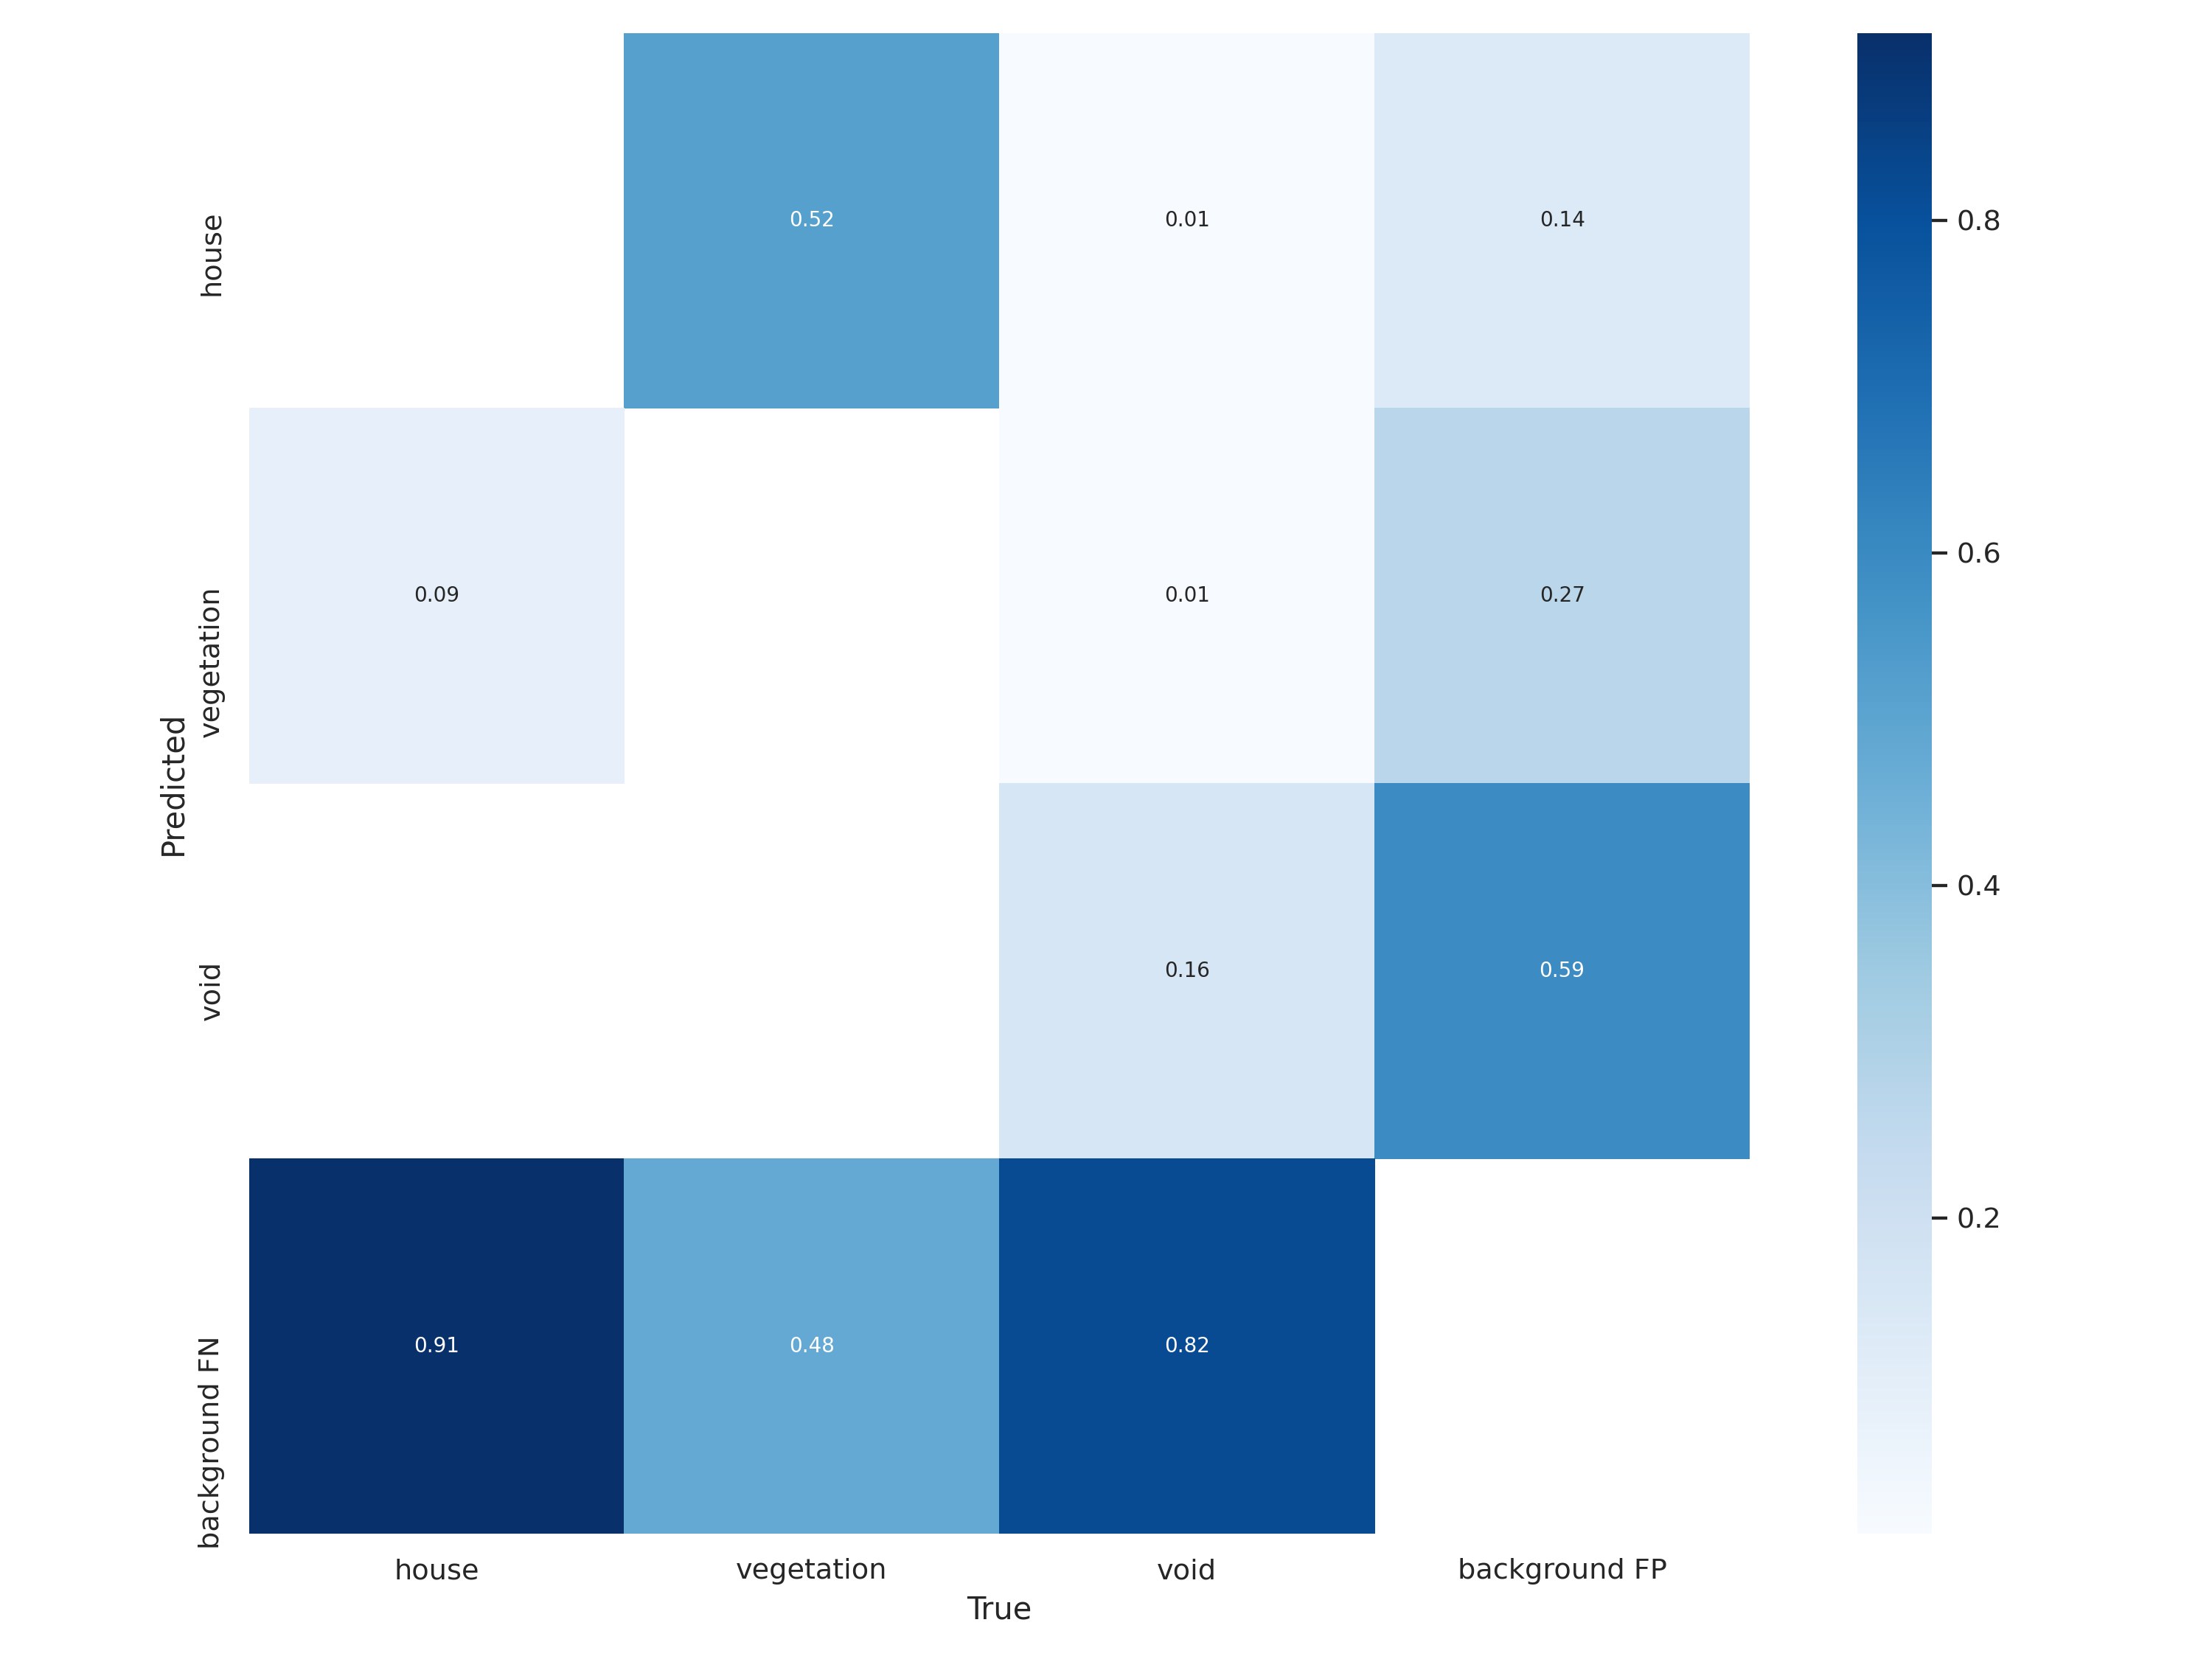
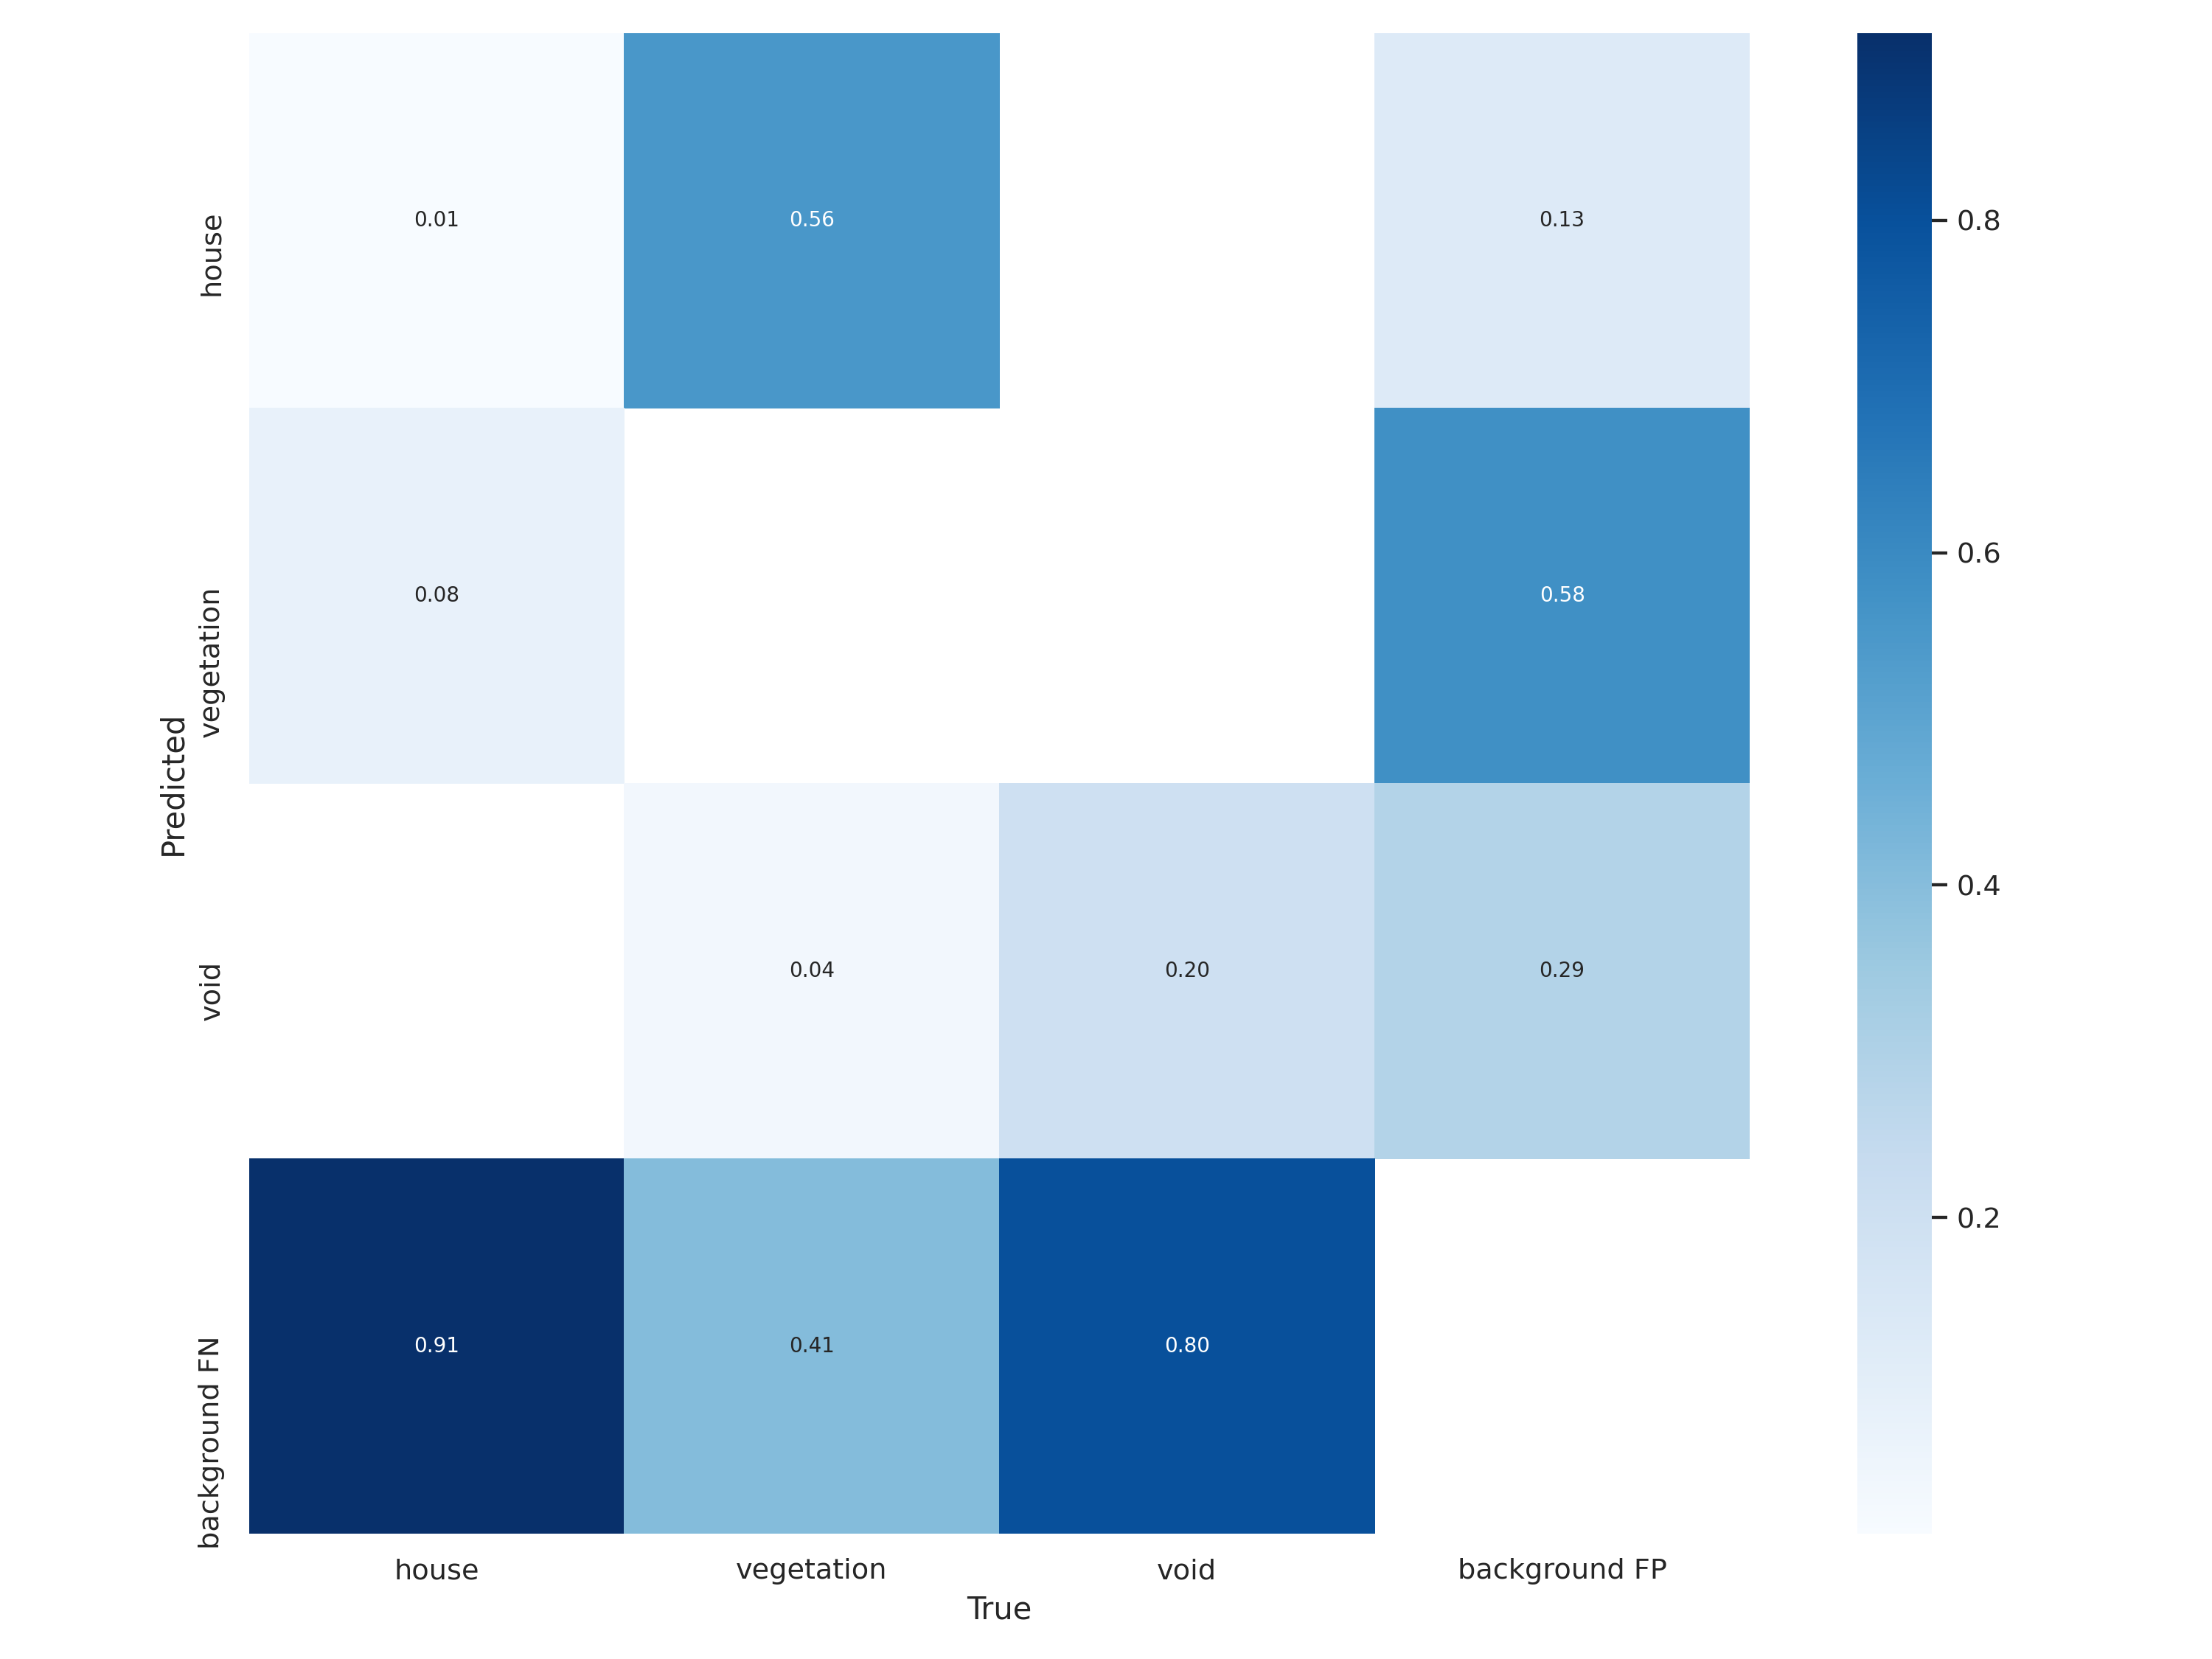
*Confusion matrix : represent number of false, also known as an error matrix, is a specific table layout that allows visualization of the performance of an algorithm.
The diagonal elements represent the number of points for which the predicted label is equal to the true label, while off-diagonal elements are those that are mislabeled by the classifier. The higher the diagonal values of the confusion matrix the better, indicating many correct predictions.
As we can see, by increasing epochs values, the error matrix is also changed.
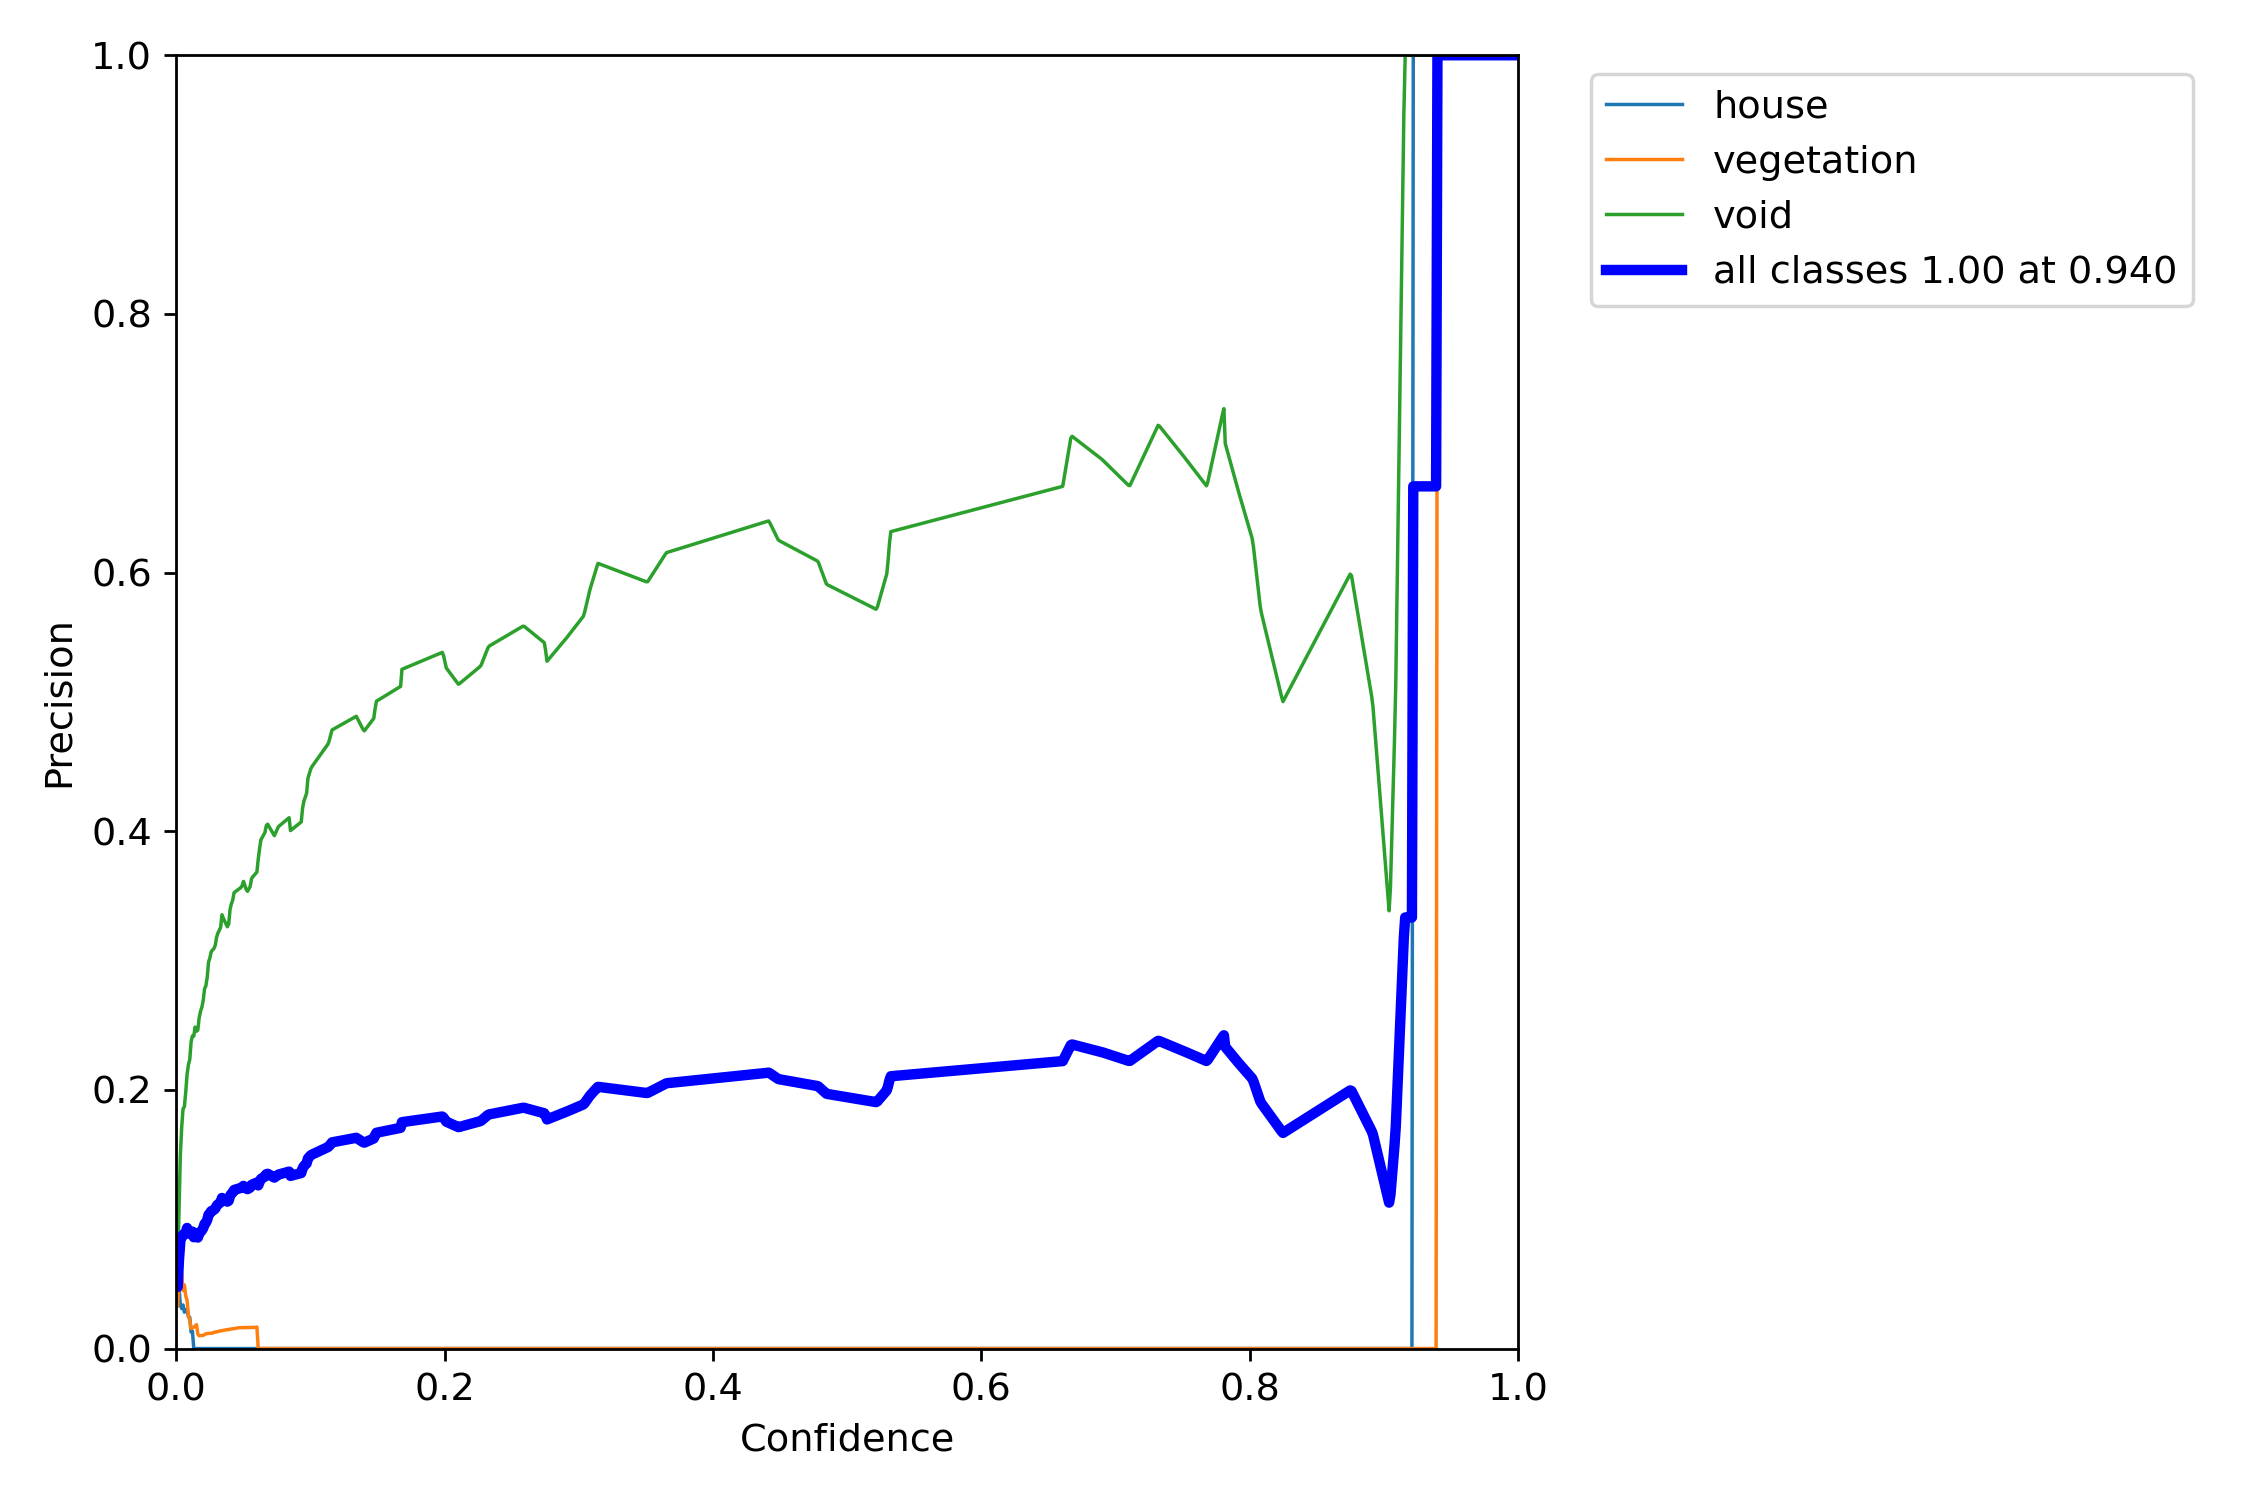
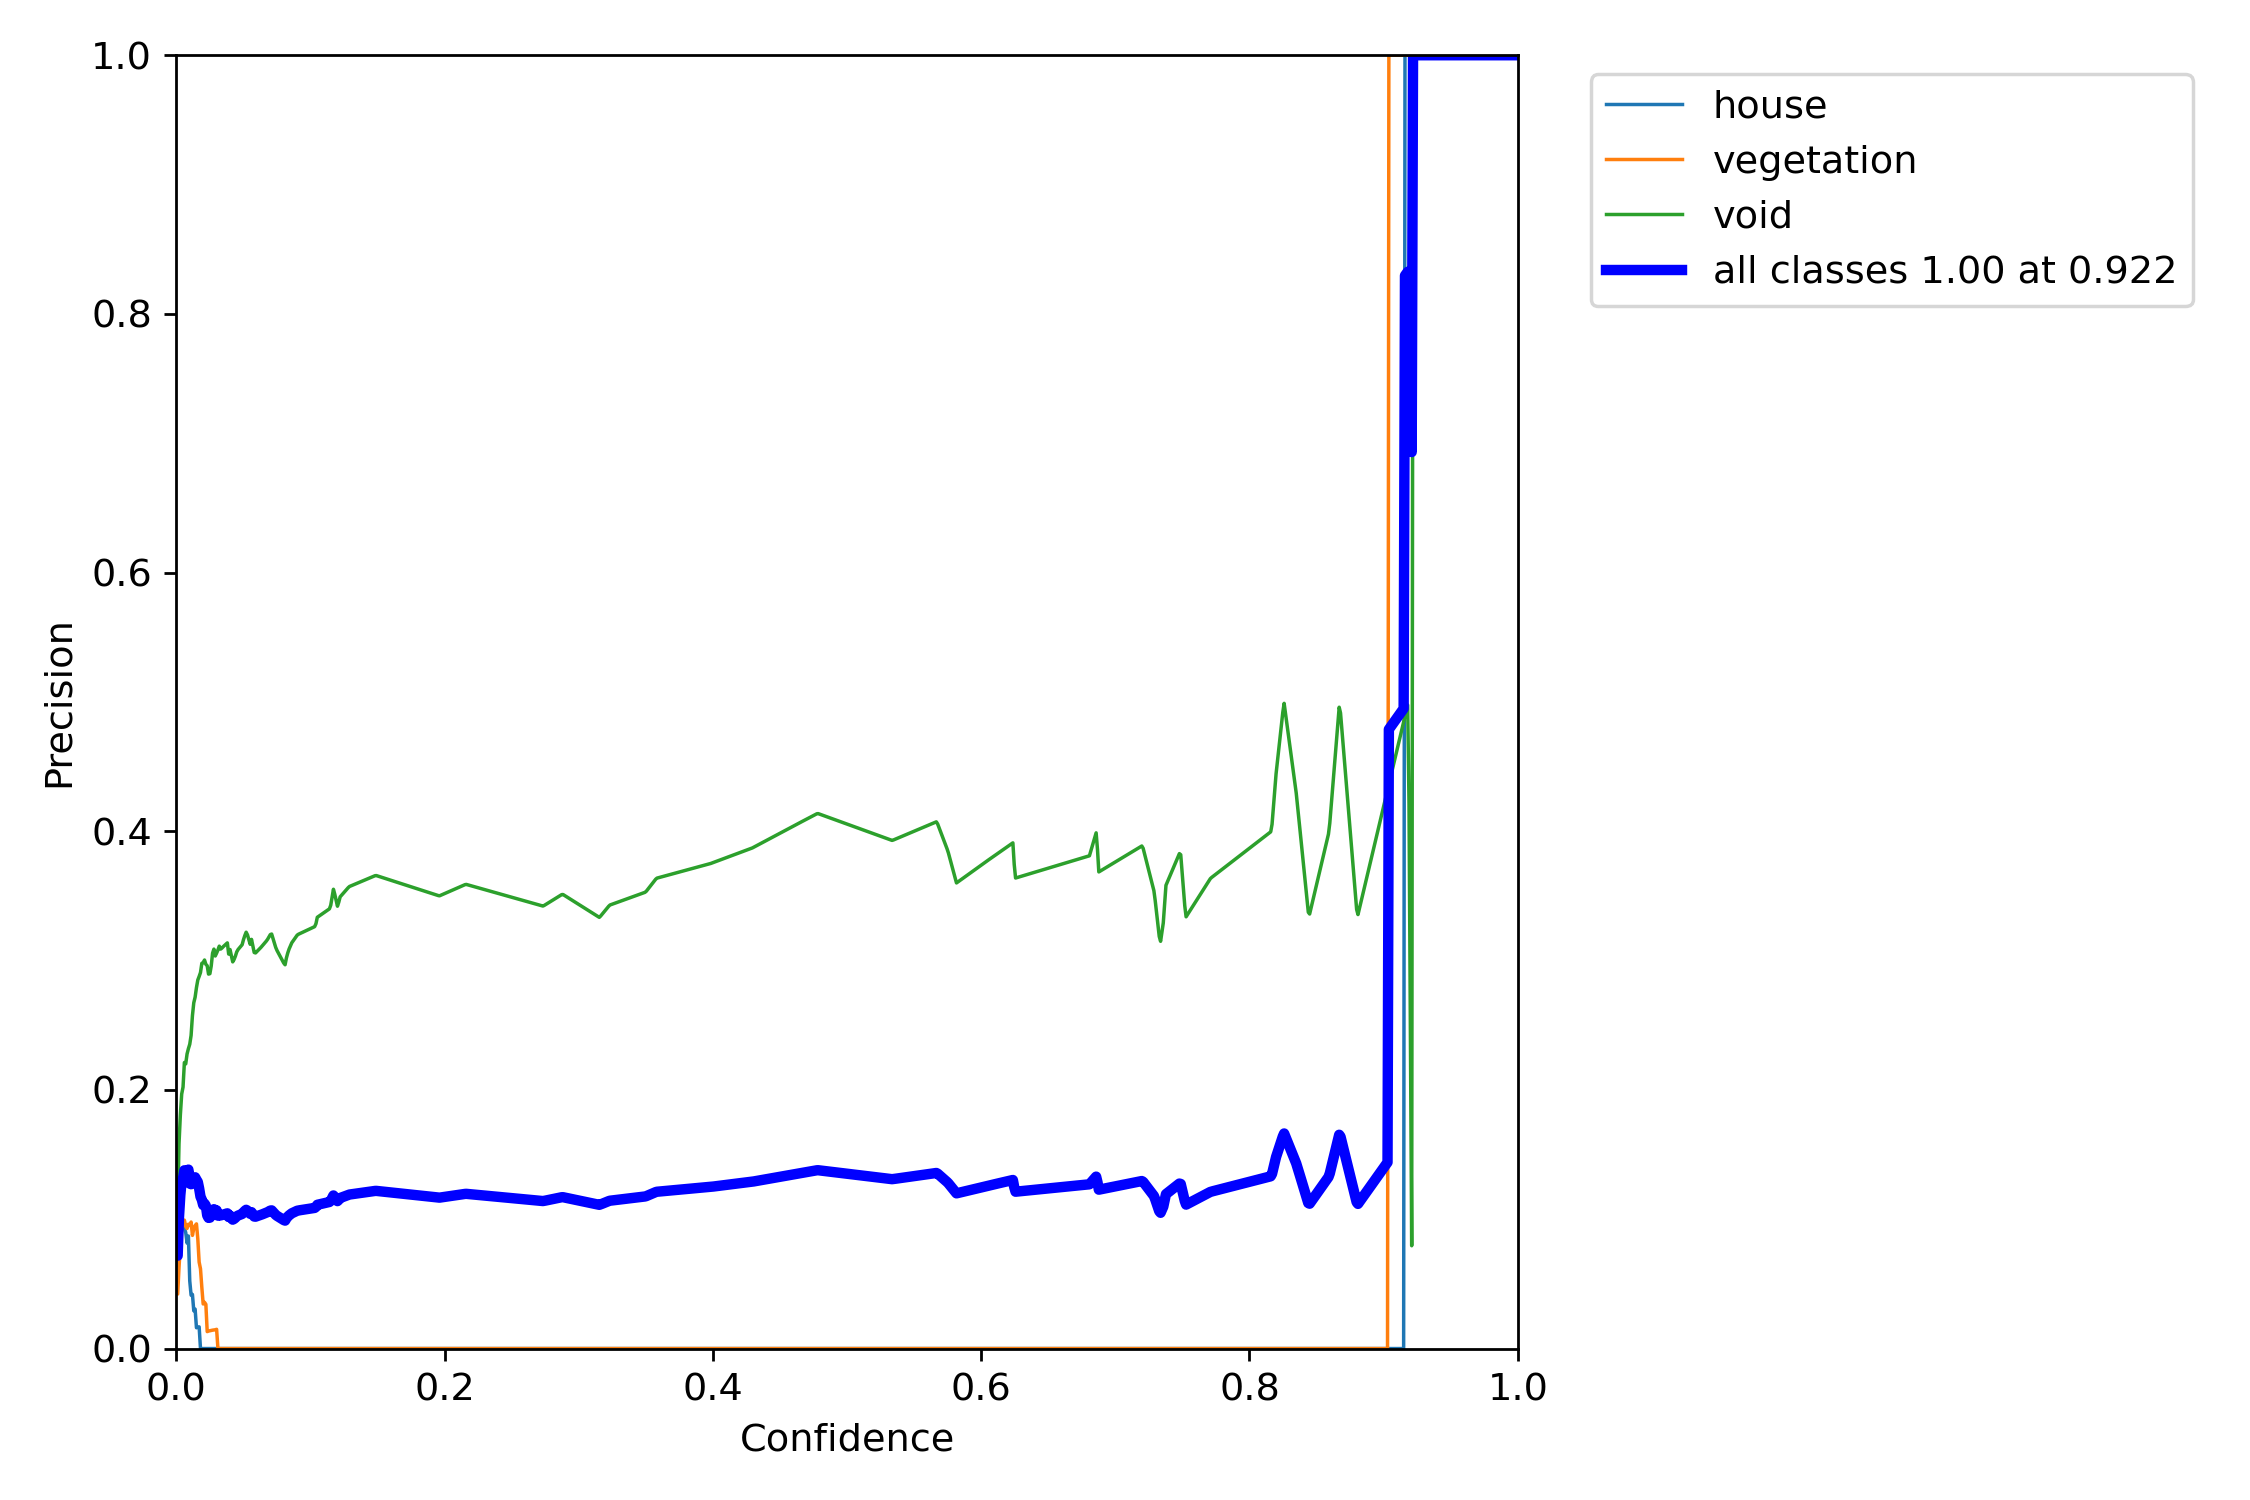
P-Curve
<Model 1>
<Model 2>
<Model 3>
<Model 4>
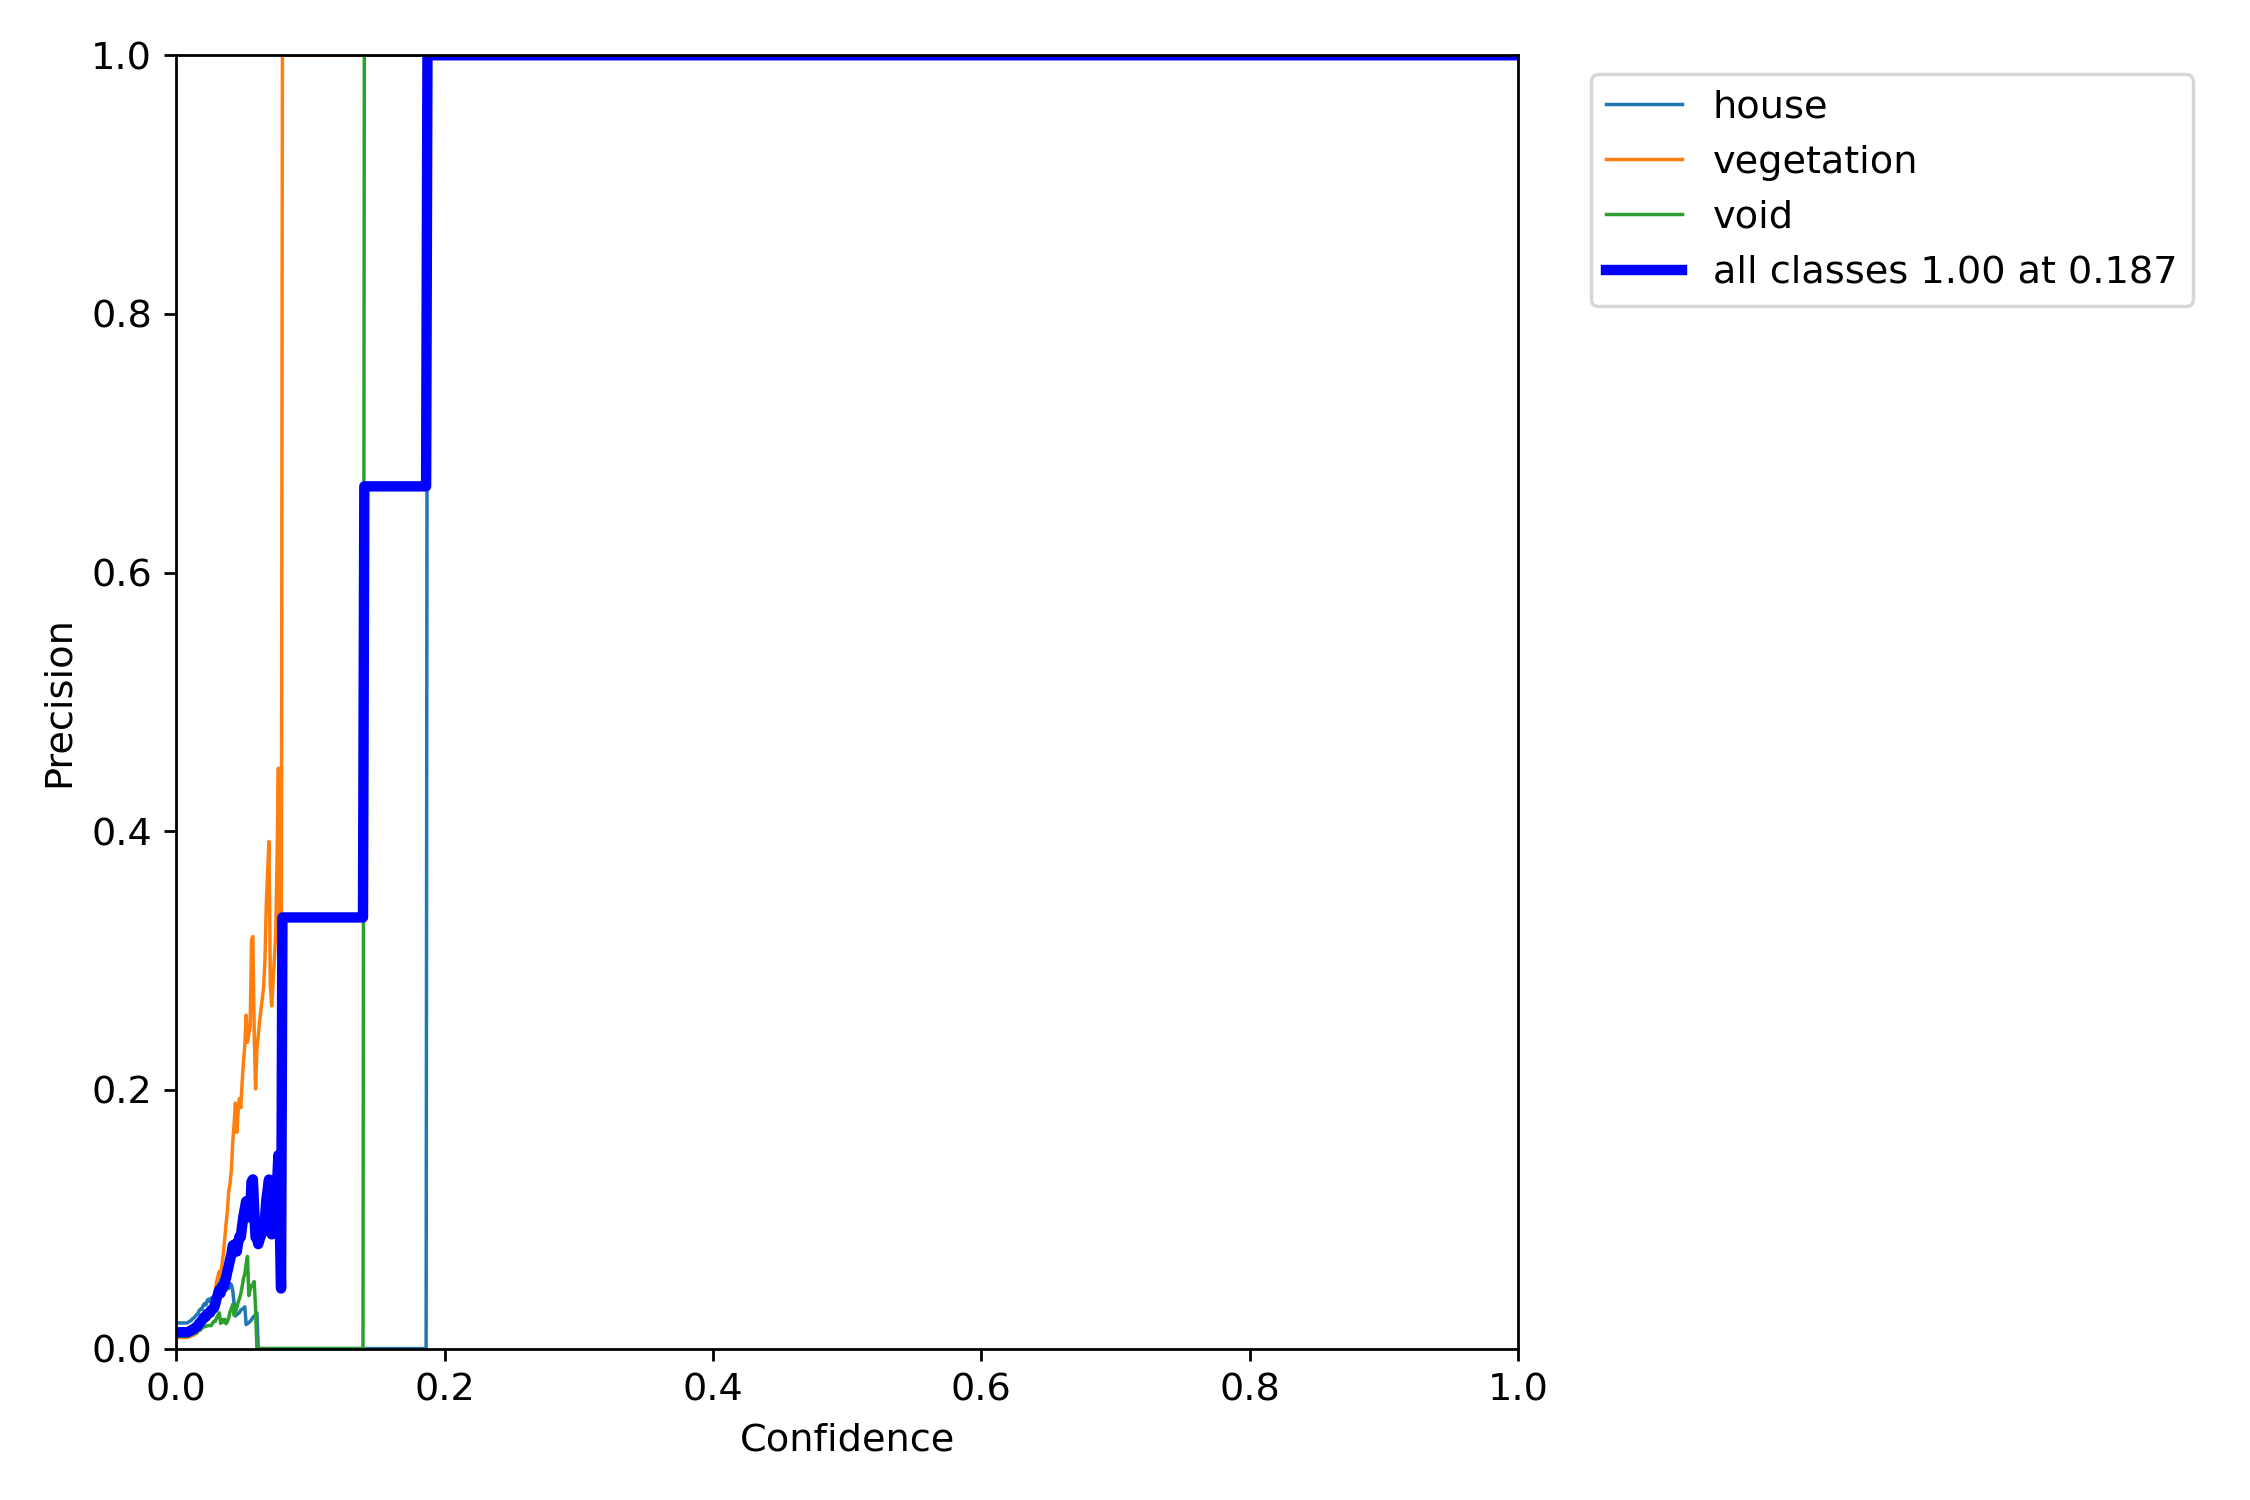
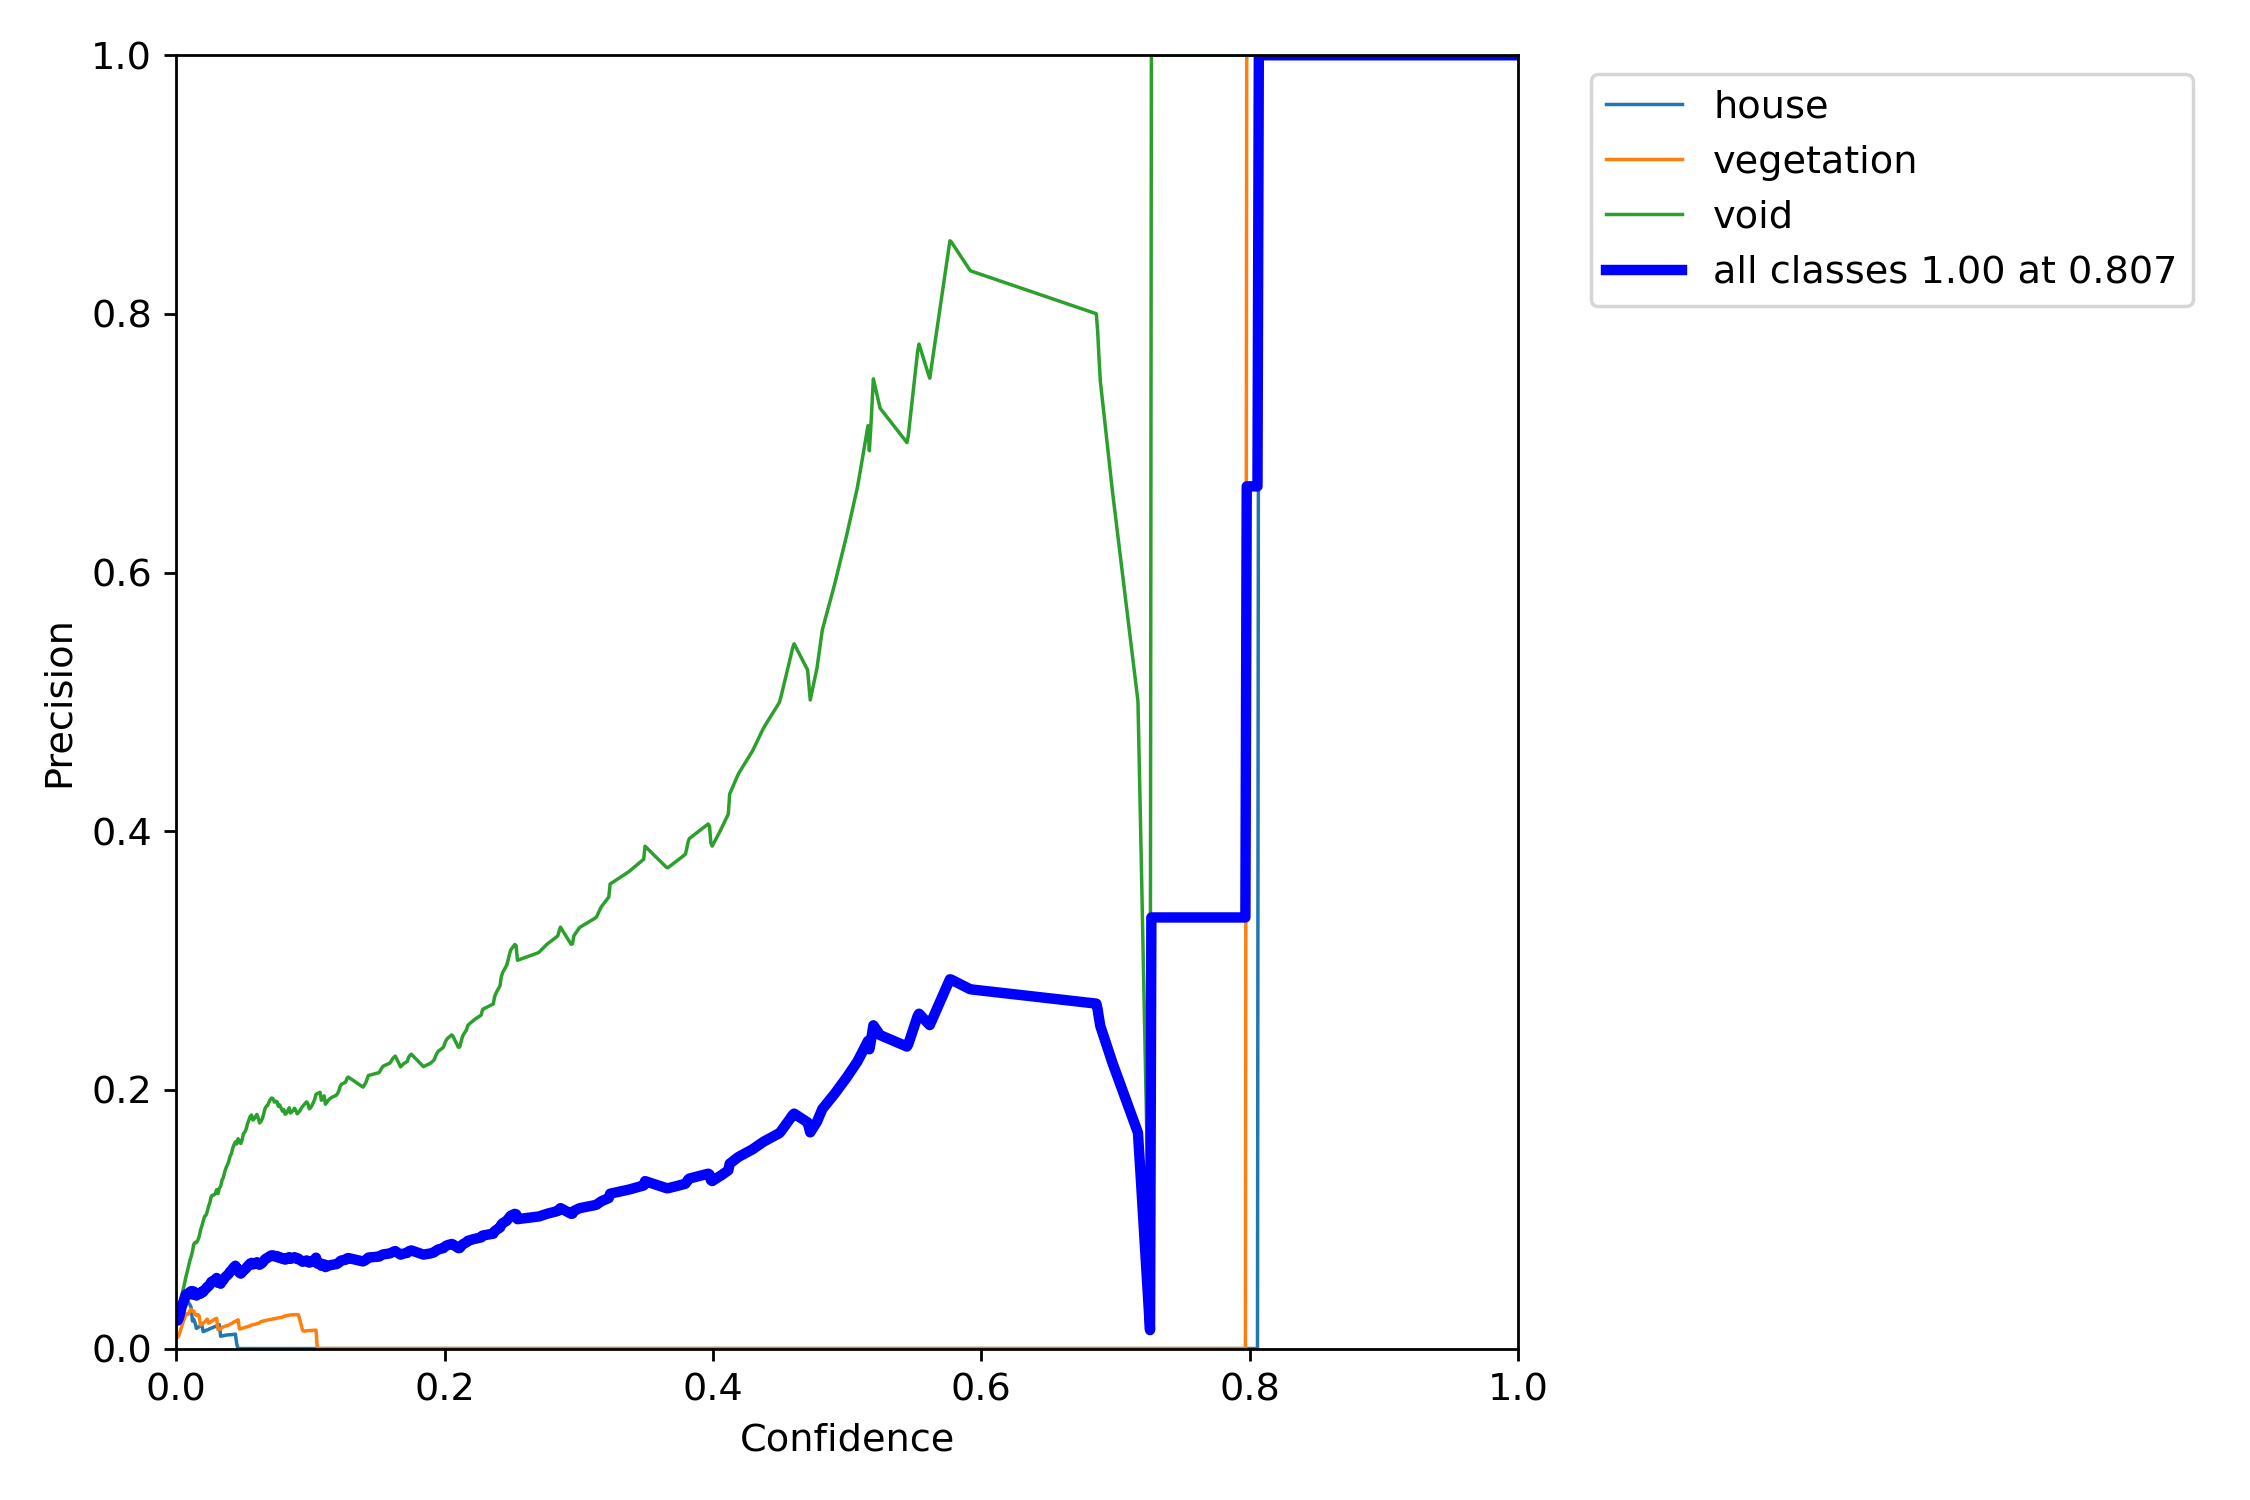
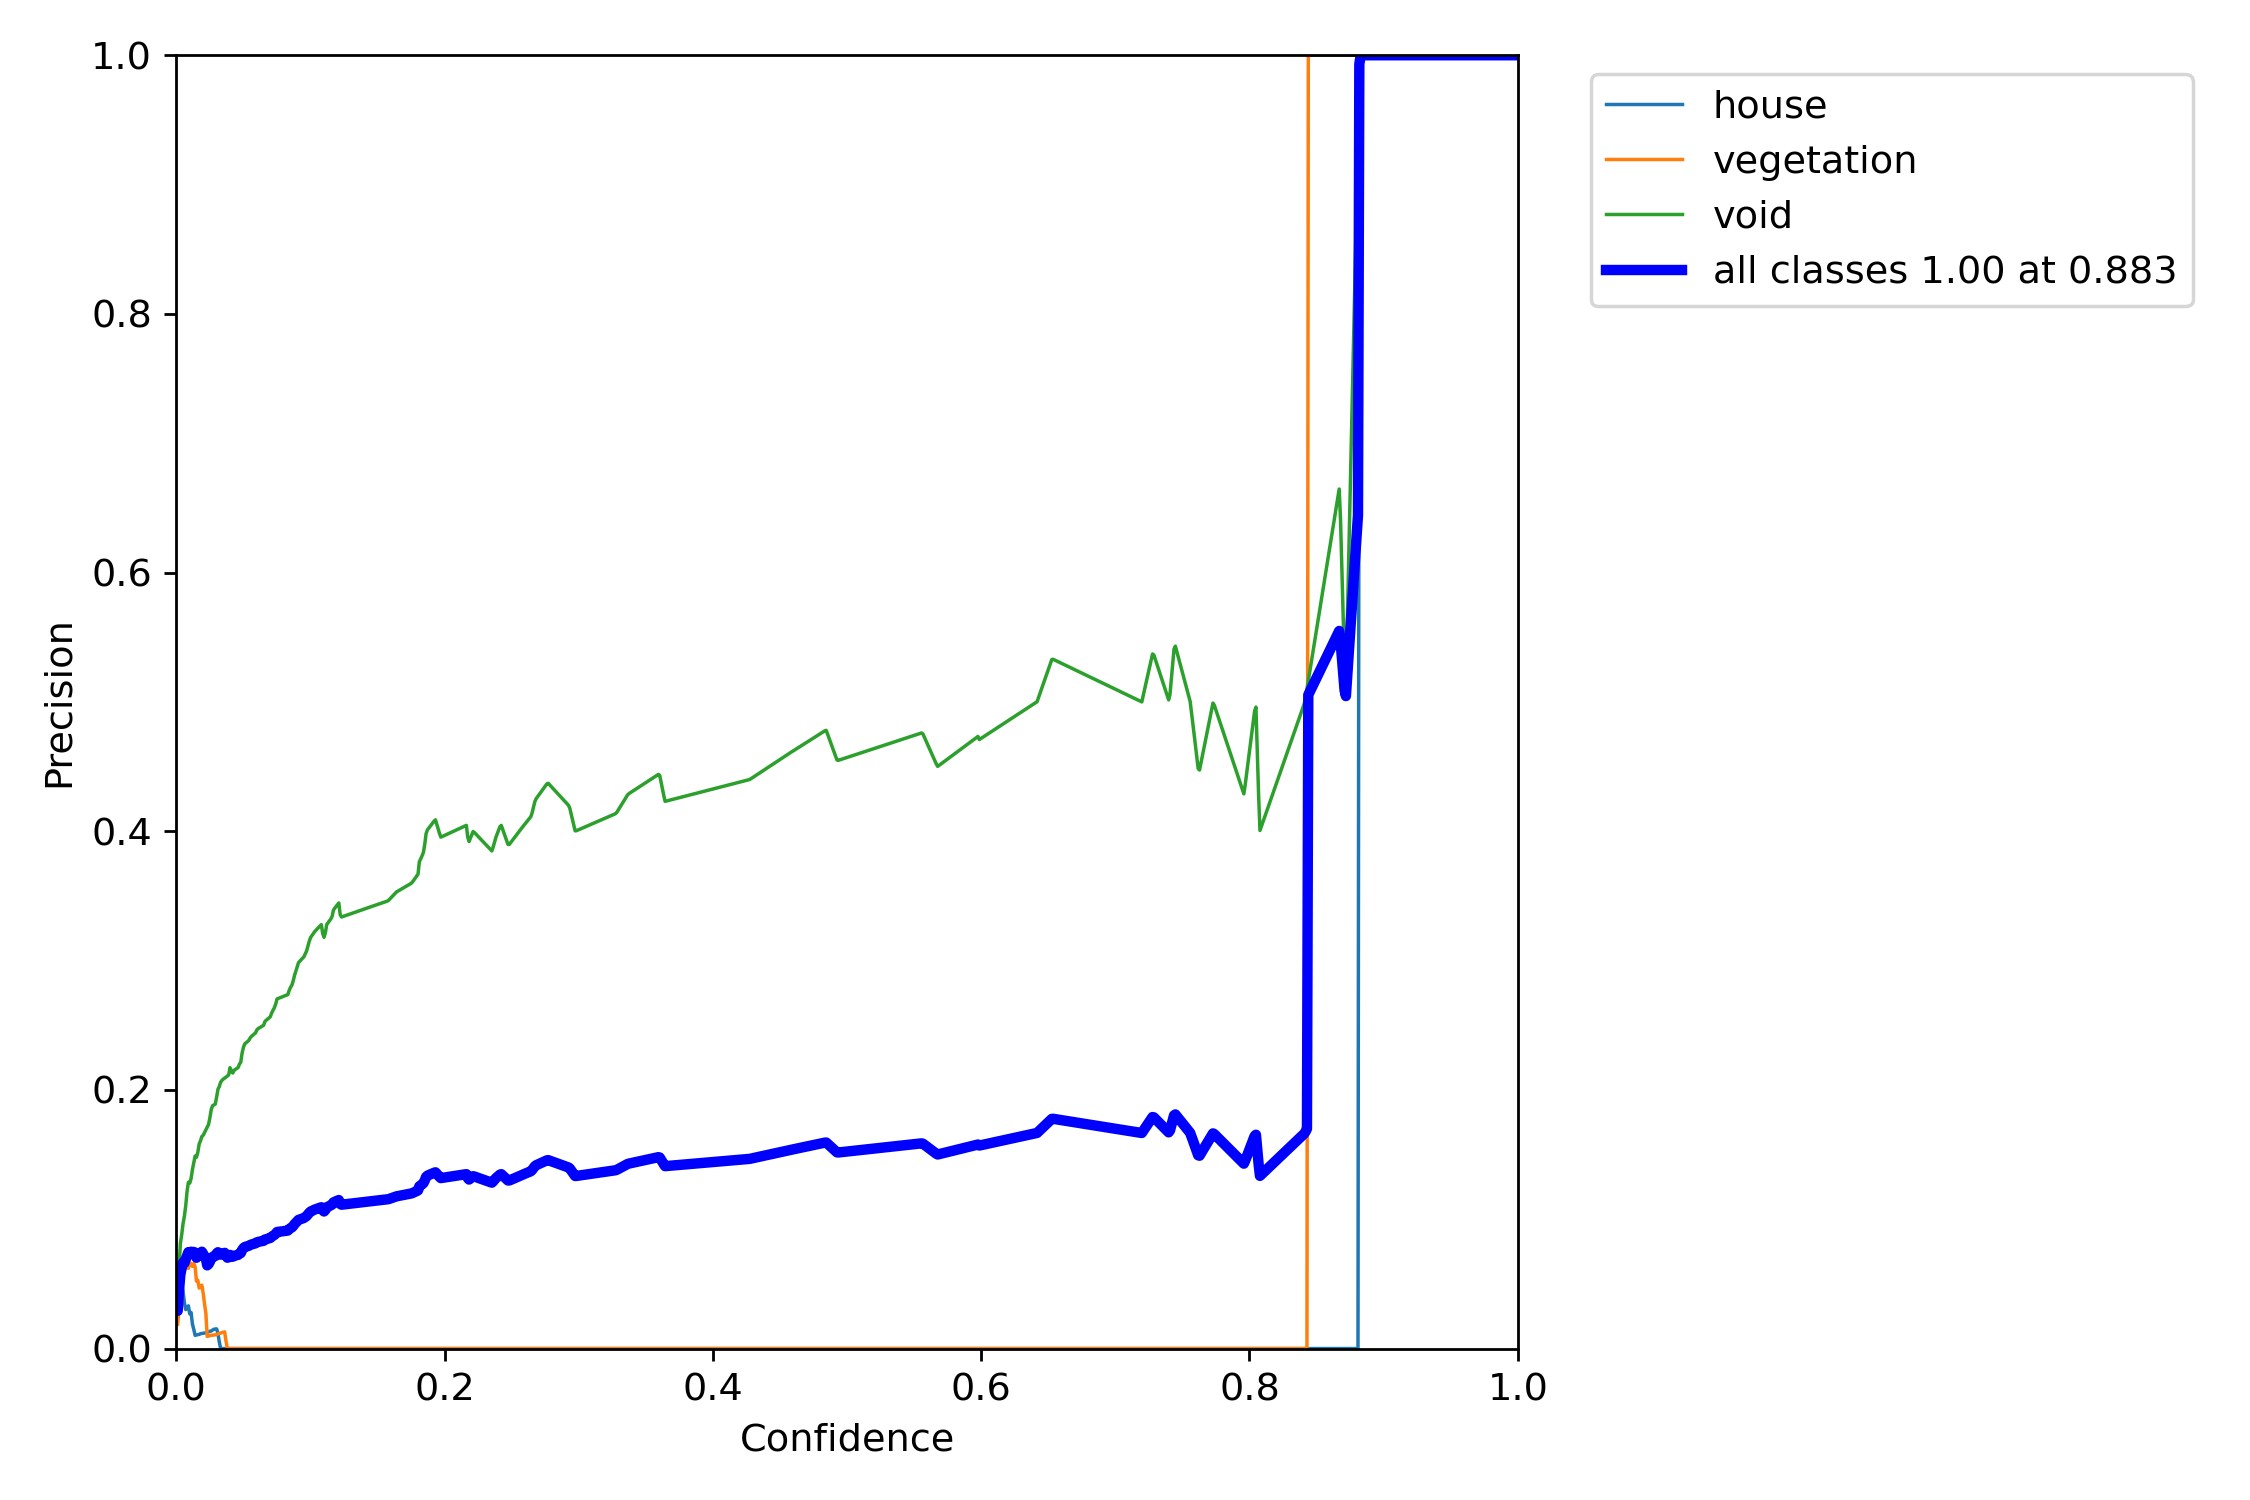
*P-curve is the probability of obtaining test results at least as extreme as the results actually observed.
The correct interpretation of a 95% confidence interval is that “we are 95% confident that the population parameter is between X and X.”
Orange and light blue line which are vegetation and house, are has a good precision result. Nevertheless, void green line is above of the all classes blue line. We think that this graph explain some miss-detecting of void object.
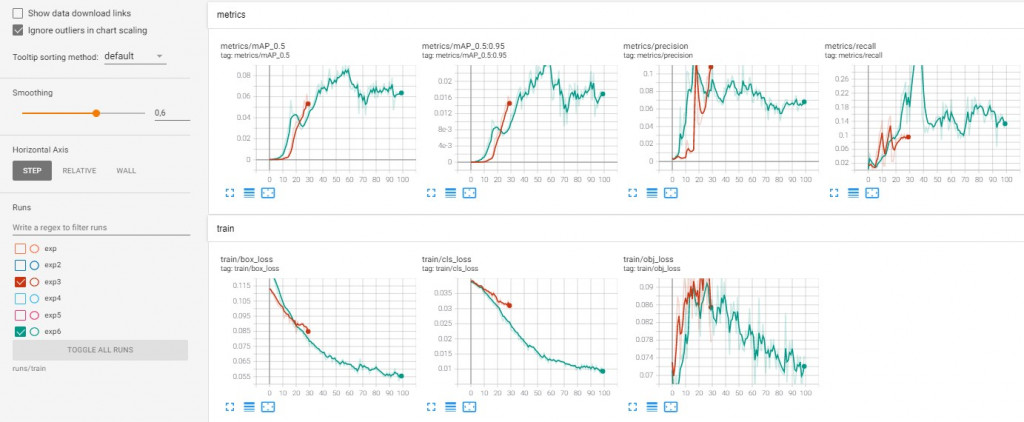
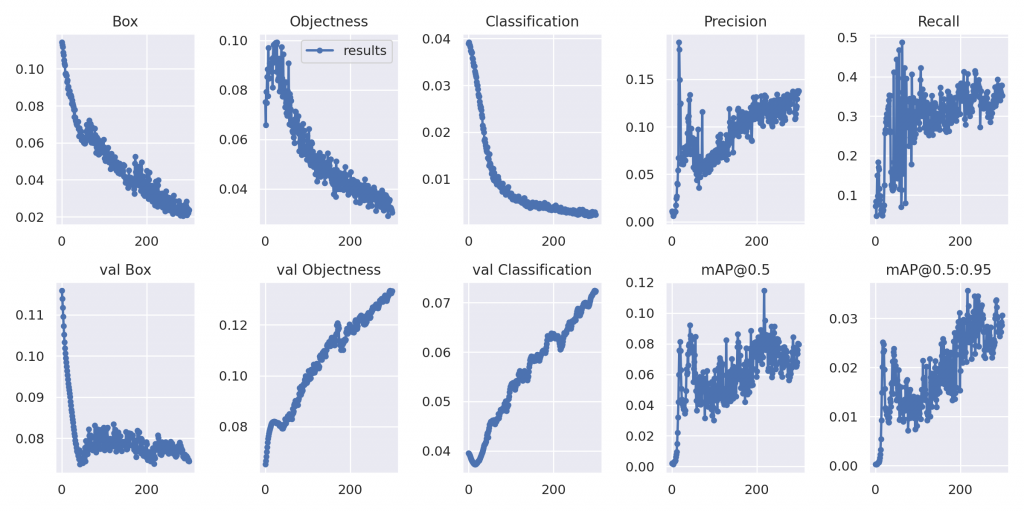
TensorFlow graph comparison
<Model 1 & Model 2>
 <Model 3 & Model 4>
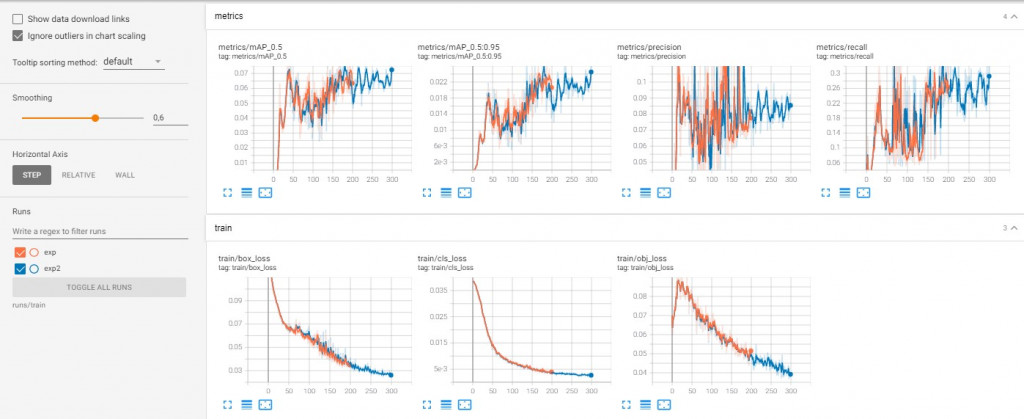
* The general definition for the Average Precision (AP) is finding the area under the precision-recall curve above. mAP (mean average precision) is the average of AP. In some contexts, AP is calculated for each class and averaged to get the mAP. But in others, they mean the same thing. Recall is a metric that quantifies the number of correct positive predictions made out of all positive predictions that could have been made. Unlike precision that only comments on the correct positive predictions out of all positive predictions, recall provides an indication of missed positive predictions.
Metrics/precision and recall values are improved although the graph of model 3 and 4 are fluctuated. Train / Obj_loss values are well decreased and better at the Model 3 and 4.
Final model (Model 5)
Epochs : 300 / Batches: 10 / Weights : yolo5 l / Img size : 640
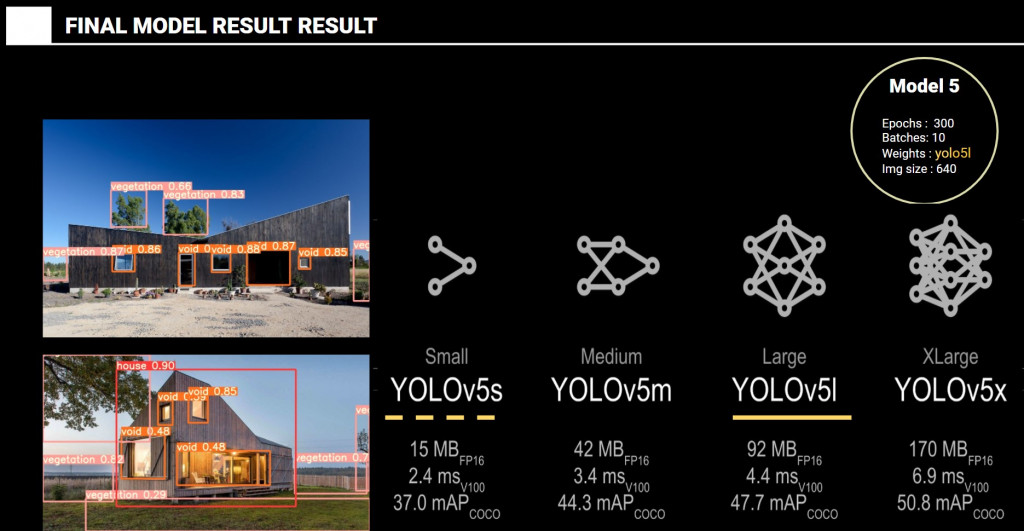
By increasing epochs value until 300, the object detection precision is also improved. However, after 300, the change was not remarkable and processing time took much more then precious options. But also, changing YOLO version model from 5s to 5l is also improved result a lot. But XLarge required a big ram space and it didn’t work at the Google Colab.
Video Object detection
Model – A
Epochs : 50 / Batches: 10 / Weights : yolo5 s / Img size : 640
Model – B
Epochs : 300 / Batches: 10 / Weights : yolo5 s / Img size : 640
Model – C
Epochs : 300 / Batches: 20 / Weights : yolo5 l / Img size : 640
Again, Epochs 300 and yolo version 5l gives better result than others.
Conclusion
Two key aspects experimented in this project are:
- The proper framing of objects by the user, and the incidence in the overall results of the weights of the images.
- The differences of small with large weights are highly remarkable, in the void object detection that was the most complex object to detect with a decrease in the loss of around 30% in average.
Next steps
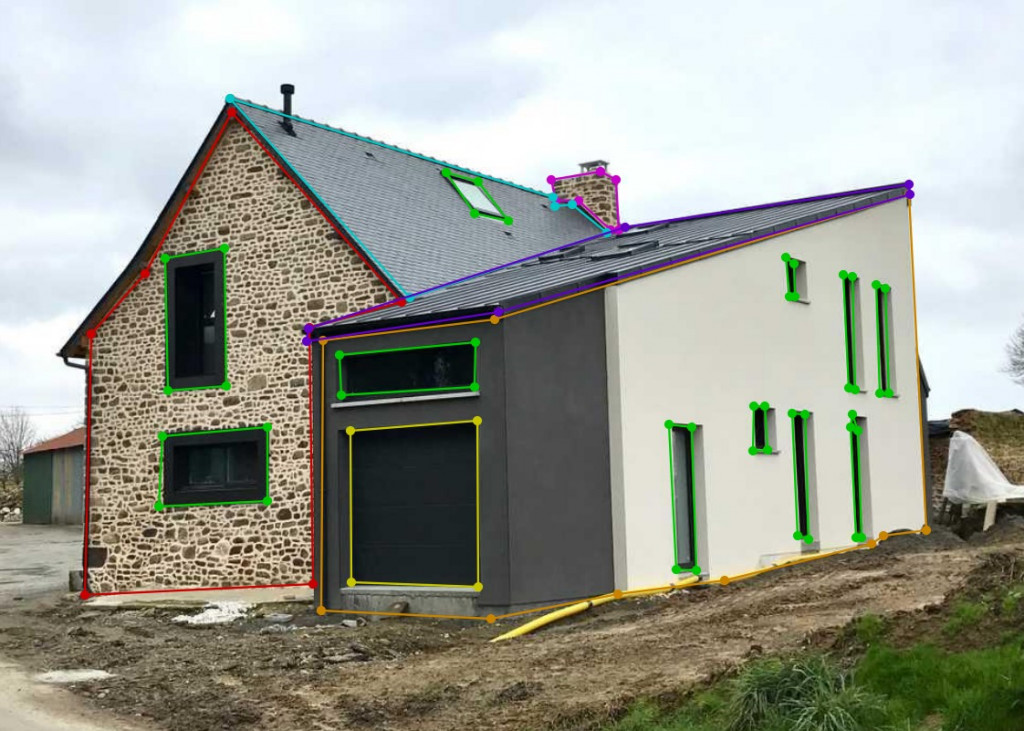
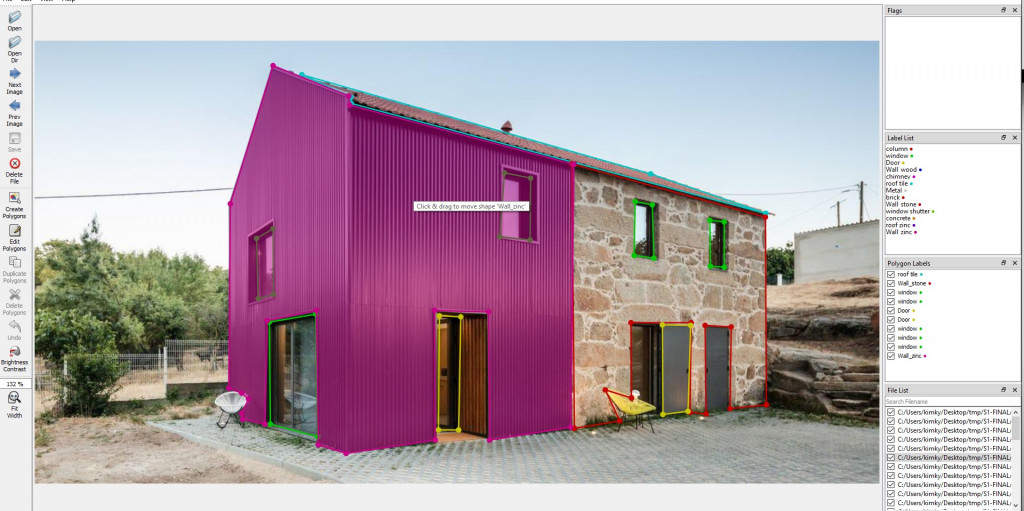
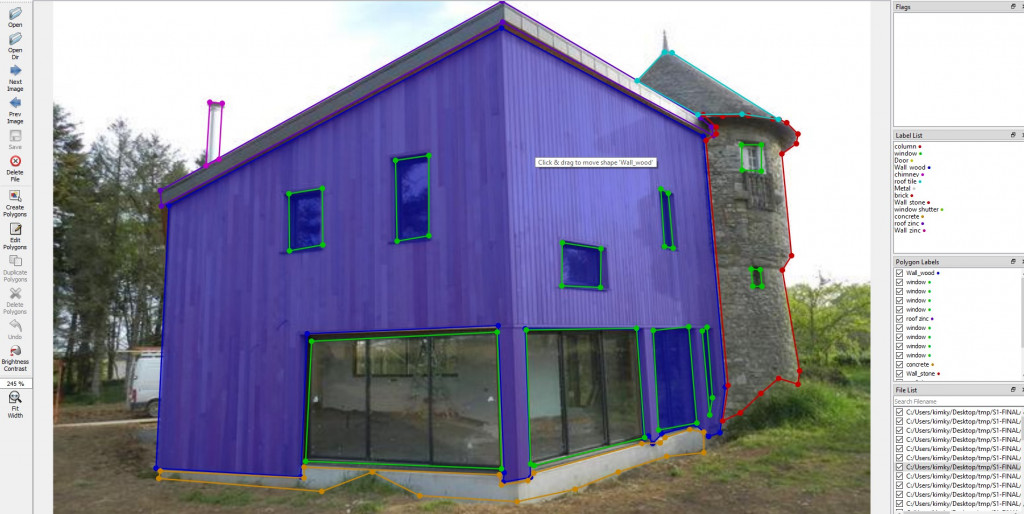
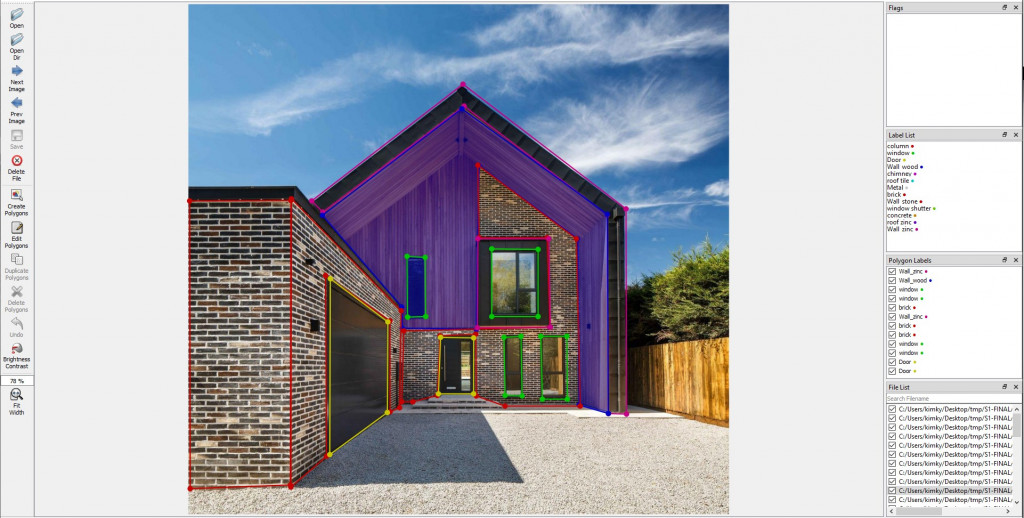
Our final objective of this project is to detect material of architecture. As this is supervised learning, we use Labelme program that made from mit.edu in order to make a train data by drawing region ourselves. We may can use semantic segmantation or instance segmentation with YOLACT or Mask R-CNN.
Artificial Intelligence for Architecture- MaCAD // Institute for Advanced Architecture of Catalonia
Kyunghwan Kim
Tomas Vivanco
Faculty: Stanislas Chaillou, Oana Taut