UBER vs TAXI
Is Uber damaging the taxi industry in Barcelona?
In the Digital Tools & Big Data I seminar, we collected and analyzed real time data using Python in order to find out whether Uber is damaging the taxi industry in Barcelona.
UBER IN BARCELONA
Uber has been a bit of a controversy in Barcelona. In fact, its operation had been banned for 3 years after a judge ordered Uber to cease all of its activities in 2014. Earlier this year, Uber was reintroduced as UberX with a new regulation requiring Uber drivers to obtain a VTC licence.
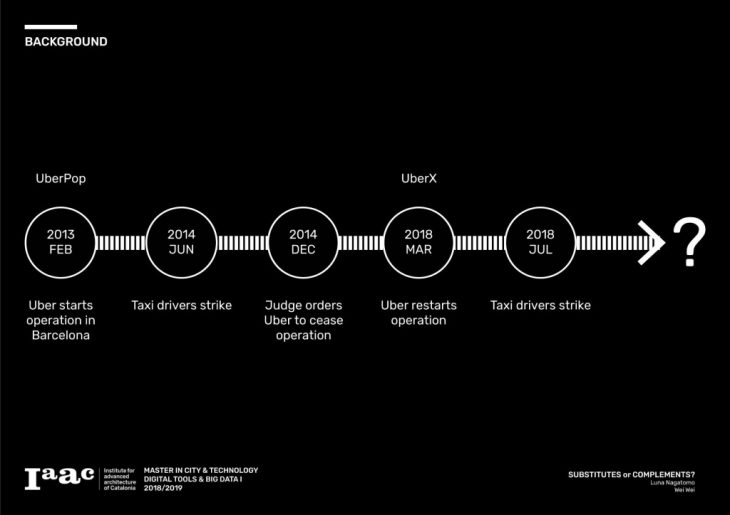
In July 2018, taxi drivers went on a strike once again, demanding for a previously agreed ratio of 1 VTC licence per 30 taxi licences to be honored [1]. The current ratio in Catalonia stands at about 1 VTC licence per 6.7 taxi licence [2].

METHODOLOGY
First, we selected 100 random points in the center of Ciutat Vella as Uber pickup points and 100 random points within the city of Barcelona as drop-off points using BoundingBox.
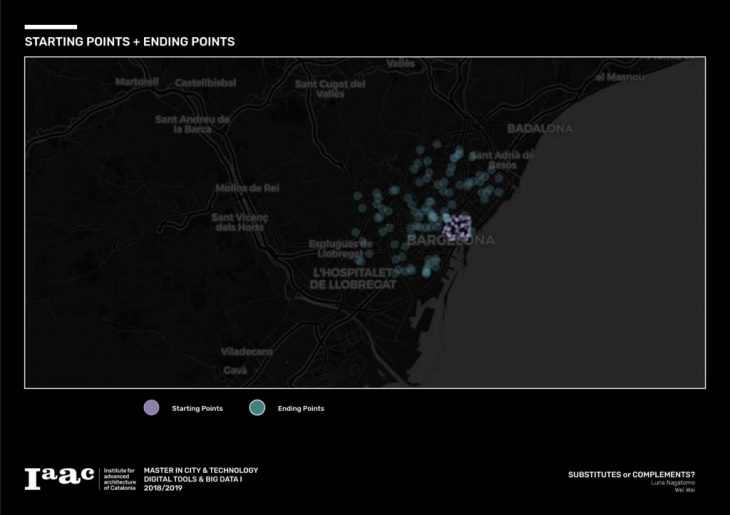
Second, we determined the routes connecting the pickup and drop-off points using openrouteservice.

Third, we collected real time estimated Uber prices for the routes above using the Uber Developers API. We collected data every 3 hours on Sunday 2nd December and Monday 3rd December.
FINDINGS
The maps below illustrate the estimated price of Uber rides at three different times on Sunday. The radius of the drop-off points are correlated with the estimated price of each rides. There was a price surge at 12:00 noon and a higher price surge at 18:00 pm.

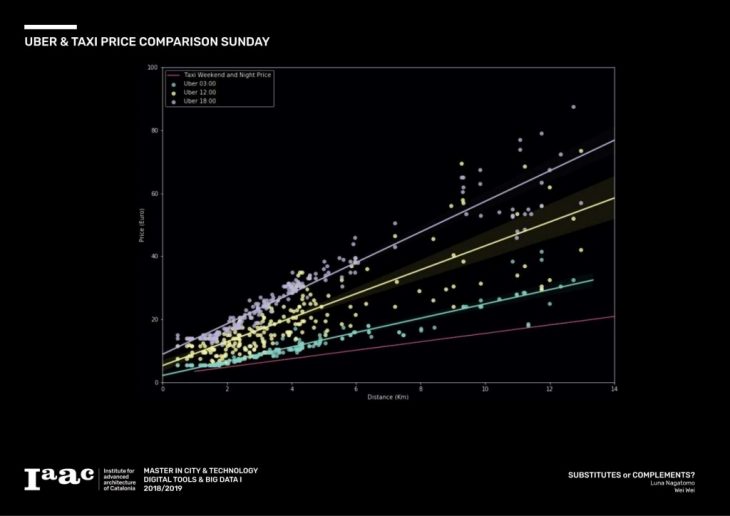
Below is a scatter plot of the estimated price of Uber rides and distance at three different times corresponding to the maps above. The price of taxi on weekends/nights is shown in the line chart for comparison [3]. Estimated Uber prices were most expensive at 18:00 pm followed by 12:00 noon and 03:00 am. Uber prices were more expensive than taxi at all times.
The maps below illustrate the estimated price of Uber rides on Monday. There were less price differences between the three different times compared to that of Sunday.

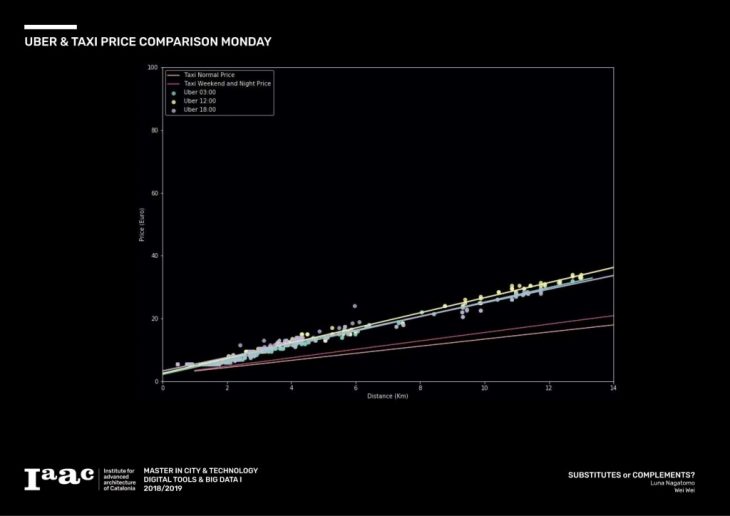
Below is a scatter plot of the estimated price of Uber rides and distance corresponding to the maps above. The price of taxi on weekends/nights and weekdays are shown in the line charts for comparison.
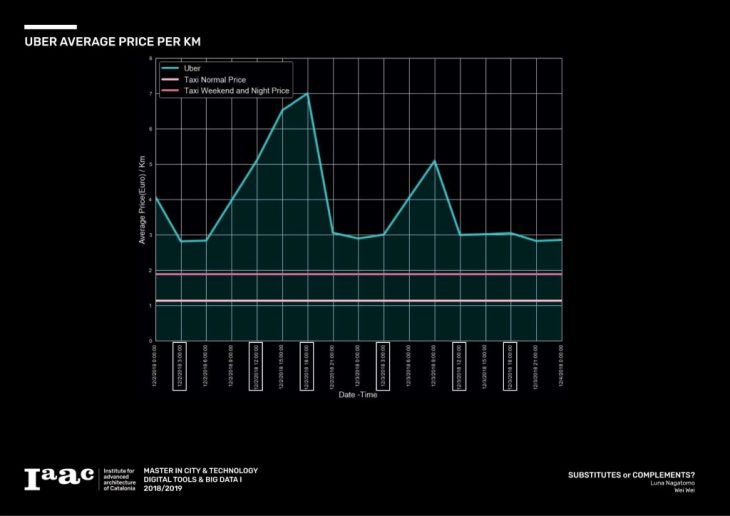
The diagram below summarizes the average estimated price of Uber per km on Sunday and Monday. The average price of taxi per km is also included for comparison. Uber was more expensive than taxi at all times throughout the data collection period with highest price surge at 18:00 pm on Sunday and 9:00 am on Monday.
CONCLUSION
We cannot make a general conclusion as the data only represents 2 days in December 2018. However, this analysis suggests that Uber’s price and number of drivers in Barcelona are managed to complement taxis rather than substitute them. In other words, Uber is not damaging the taxi industry in Barcelona, contrary to the claim of the taxi drivers, even with the current VTC to taxi licence ratio of 1 to 6.7.
Further analysis of real time data is recommended to assess the effect of Uber on the taxi industry and determine the desirable balance of Uber vs taxi in Barcelona.
Is Uber damaging the taxi industry in Barcelona? is a project of IaaC, Institute for Advanced Architecture of Catalonia developed at Master in City and Technology in 2018/2019 by:
Students: Luna Nagatomo and Wei Wei
Faculty: Starsky Lara