The system Intraspace is an Augmented Reality platform. It aims to help users of open plan dynamic interiors – spaces enabled with smart material and sensor-actuation systems – by providing configuration suggestions and data visualization.
Fact is, our spaces are already riddled with data sources and remotely activated systems. By bringing together the data flows, the system will provide suggestions to optimize for user comfort level and space use efficiency. As opposed to most of current egocentric AR applications the platform is linked to a space. Additionally in the range of current AR for architecture developments, project aims to focus on post-construction scenario, rather than design or construction phase – filling the niche in the market.

Intraspace Demo
Coding
Overall system consists of three main acting agents: user with an interface, sensing and/or actuating device and space-wide server. In this blog-post I am focusing on the server side processing and more specifically spatial data visualization. Presented Python script has been developed as part of a larger Grasshopper solution collecting sources, processing data and synchronizing results with the user’s interface. Thus overall script between networking start and end consists of:
- Extract geometry encoding from network message;
- Decode the geometry;
- Modify the geometry according to synchronized and monitored over time inputs;
- Encode new geometry;
- Pack data into network messages;
- Compress messages together to decrease latency.
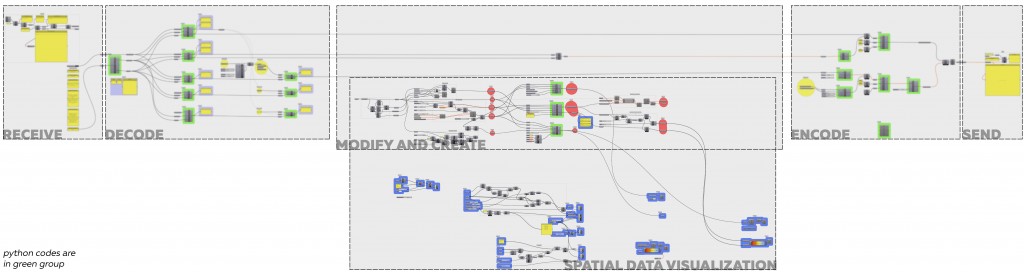
Intraspace | Script Diagram
Spatial Data Visualization
To start of, Augmented Reality platform has unique possibility – by being spatially aware digital layers can become spatial as well enabling us to visualize in a more intuitive way in the space itself. Further more having more freedom with three dimensions one can start to introduce more dimensionality in data as well: spatial dimensions, temporal data ad one dimension, scaled up or down information, etc. As such the project required developing enriched visual syntax for spatial data display.
Three primary avenues of development were selected on the intersection with this assignment:
- Spatial symbolic representation
- Heat-map
- Iso-curve field interpolation
All of them has analogous base in 2D but utilize potential of spatiality. All of them are adjusted to take into consideration the region the represented value is in – since this visualization makes sense where height is relevant in comparison to width and height. In addition, this way spatial representation, once overplayed over space will be able to fit within without causing visual interference with the boundaries of space.
All developed python script components take value location in space (points), values themselves (values), interior space region (region), among other type specific.
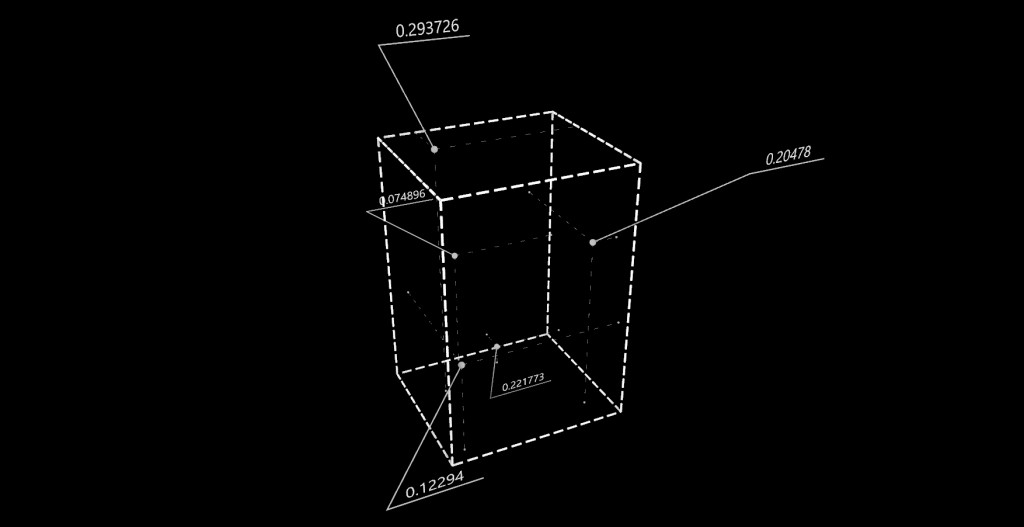
Intraspace | Python – Set Up
Symbolic representation
Going further in details, representing through symbols – is the simplest way to visualize data with direct translation from 2D analogs. Knowing where particular value is in the space and the reading in it – one can place certain geometrical objects scaled in accordance to the values. Thus this method of visualization gives simple to compute and quick to perceive intuition over the mass distribution of the field but doesn’t reveal details.
Additional inputs include unit example of symbol geometry and a scaling factor. Component outputs a brep geometries already scaled and trimmed by the surface.
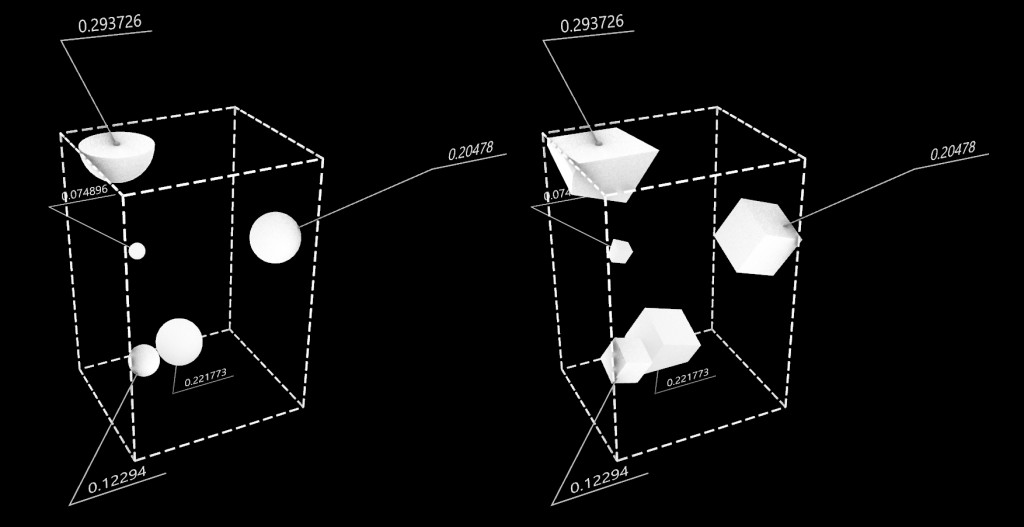
Intraspace | Python – Symbols
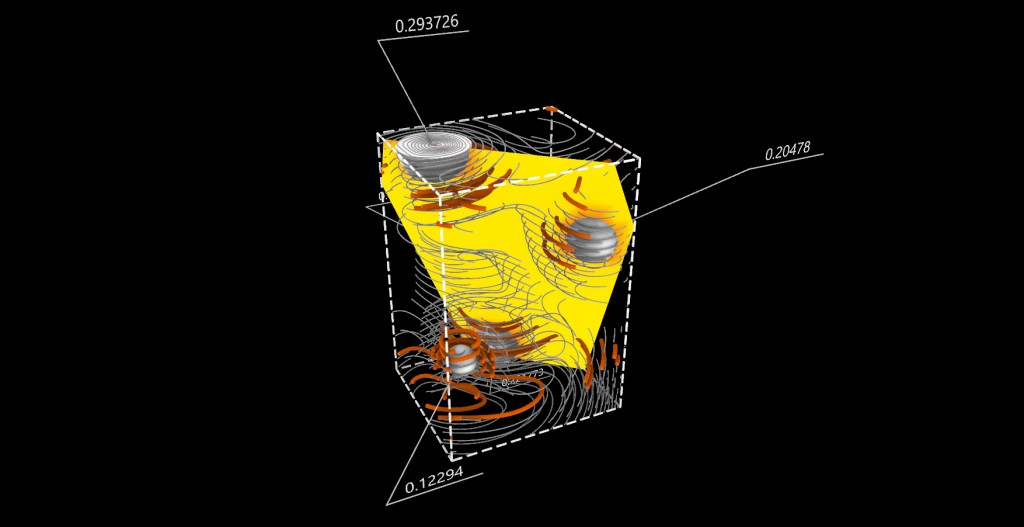
Heat-map
Important data visualization tool since allows to understand gradient and quality of the field in general. Unfortunately in 3D environment it doesn’t give you broad understanding of the fluctuations, but for it is still an important tool to see local behavior. A good example could be to preview airflow next to a source.
However, for it to work – given limited amount of data points, – data had to be interpolated by evaluating grid points on selected plane with value and distance in mind to all data points and combined into a collective value.
Additional inputs include selected plane to evaluate on, density of reevaluation on the field (both U and V count) and the gradient of colors represented as a list of equally spaced colors over the range of values in the section. Component outputs a mesh trimmed by space and colored according to calculations and the gradient.
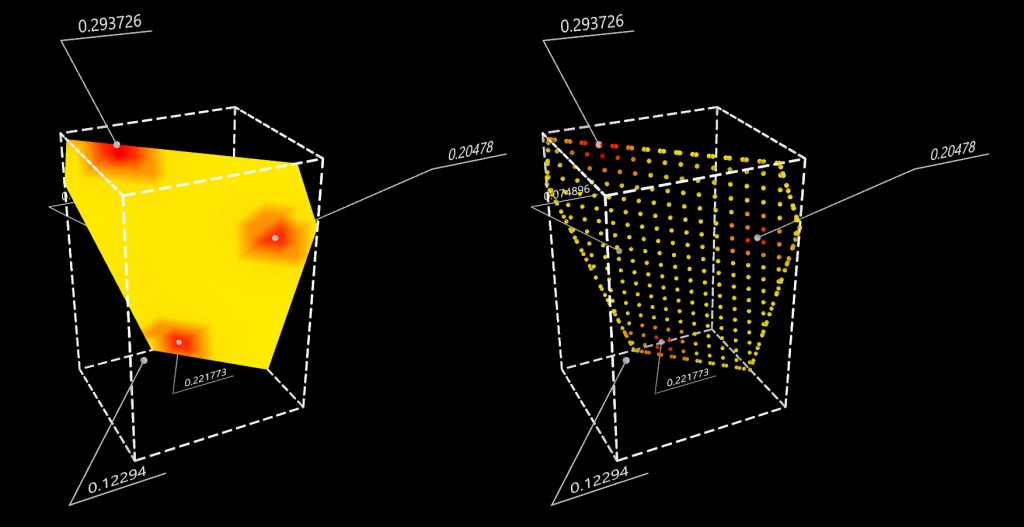
Intraspace | Python – Heat-Map
Iso-curves
This visualization method probably makes most amount of sense given that we would perceive it from within. While visually it can be transparent it conveys a lot of local deviation information. At the same time points of excessive compression or decompression, points of change get represented spatially.
Based on the same logic as before we evaluate instead over a number of sections of the space and maintaining relationship of values. In the end component structures curves not by layers of sampling but by branches of field deviation in them.
Additional inputs include a list of surfaces – layer to sample the space on, density of revaluation (both U and V count) and resolution of curve evaluation in the layers. Component output structured curves themselves and duplicated information of curve values (remapped from 0 to 1). Last is not necessary since can be extracted from tree statistics of curves, but since is calculated any way in the process maintained – since is needed later on to colorize curves to transmit to the interface-device.
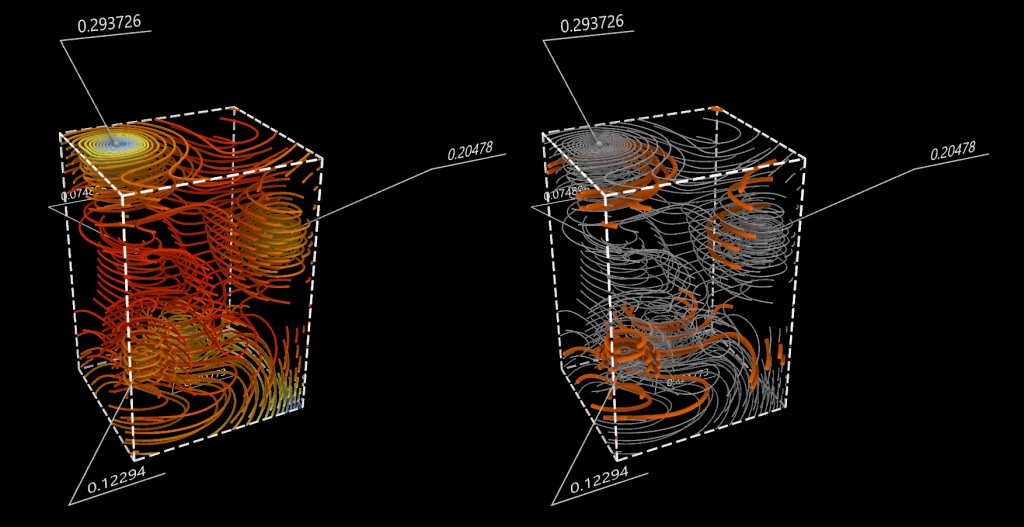
Intraspace | Python – Iso-Curves
Conclusion
Intraspace | Python – Combination
To sum it all up, this couple of elements aim to explore visualization of data in spatial configurations. While it is not excessive, it gives certain amount of freedom with respect to actual values to be represented. Further more, it is covering different scenarios where different aspects of data are more or less important. This initial step serves as a proof of concept and will be developed further as the thesis matures.
IAAC | MAA 02 | Advanced Computational Tools – PYTHON
Researchers: Daniil Koshelyuk
Thesis Adviser: Areti Markopoulou
Seminar Faculty: Angel Muñoz
2018 – 2019
