Abstract
IN-BETWEEN SPACES is a studio project of the Artificial Intelligence in Architecture Module as a part of the MACAD Program at IAAC. This compilation is dissemination of our project and the processes involved. It documents the various tools and methods we used to build the project. The intent of this documentation is to enable anyone to replicate and grow on any/all parts of the project. The project revolves around using artificial intelligence to support, document, and resolve issues of the unplanned portions in urban areas. The scope of INBETWEENSPACES expands way beyond documenting informal settlements, It involves mapping empty spaces within informal settlements through a participatory approach. Which not only aids in improving accessibility by generating new street networks. But also locates potential nodes for various infrastructure development within these organic urban systems.
The process documentation consists of resources to create data sets and train a Pix2Pix model to map unmapped portions. Followed by the use of web-based resources such as web flow and map box; focussing on their integration for building an interface to collect data through a participatory approach. It further shares how collected data can be used to inform a different Machine Learning algorithm through a Live Google sheet and how the results can be used to analyze and generate street networks within the settlement, improving the accessibility within these settlements.
SITE
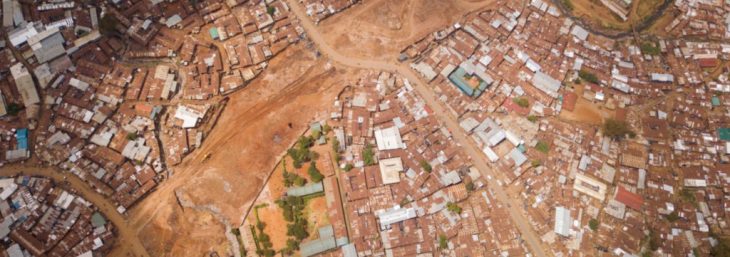
For Our project, we consider Kibera in Nairobi, Kenya. It is the largest informal settlement in Africa. The 2009 Kenya Population and Housing Census report Kibera’s population as 170,070, contrary to previous estimates of one or two million people. Other sources suggest the total Kibera population maybe 500,000 to well over 1,000,000 depending on which slums are included in defining Kibera.
WORKFLOW
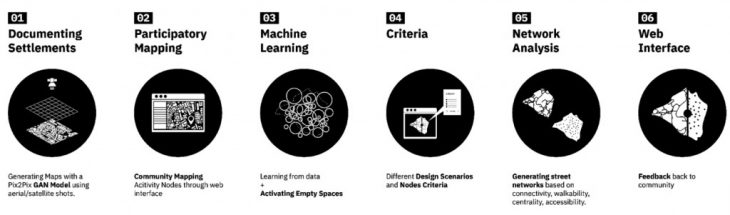
The project is made up of six main segments. We start with Generating a shapefile through a satellite image with a gan model This map is further elaborated with data inputted by the residents of the area, through a participatory web-based mapping tool. After incubating on data provided by the people, our machine learning model activates empty spaces within the settlements. Based on different design scenarios and nodes criteria Street networks are generated And analyzed with the layers of walkability, centrality, connectivity, and accessibility. Post which the feedback result is then published on the web for the community to review.
01-DOCUMENTATION
There are 3 resources we found for the maps of informal settlements. We have manual data mapped by the government and The Humanitarian OSM.
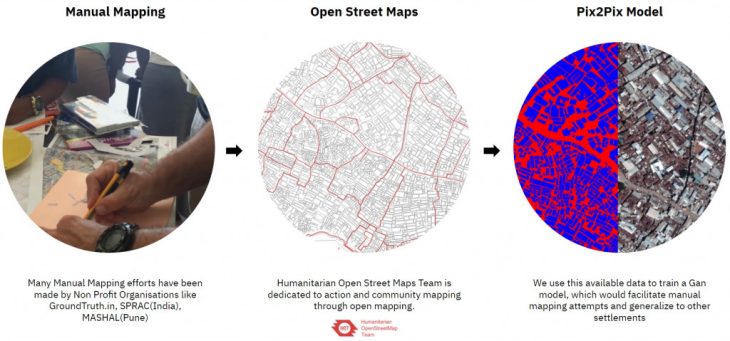
And we use the available data to create a process where we can go from satellite image to segmented image, and finally to a vectorized shapefile that can encompass undocumented portions using the pix2pix model and QGIS for vectorization.
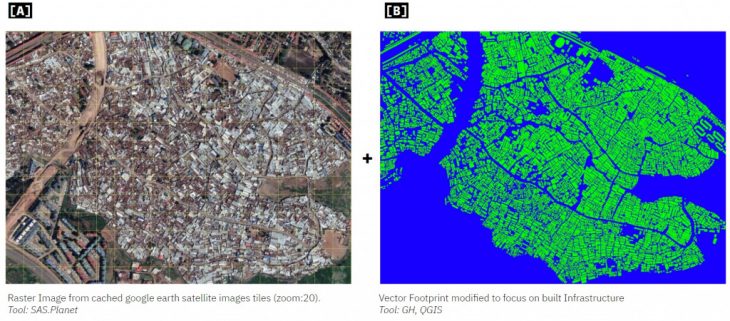
The collected satellite images are further split into tiles. We split the map into multiple tiles creating a dataset of over 2268 images for training the model. While also learning the right measures to clean data for uniform training within the model.
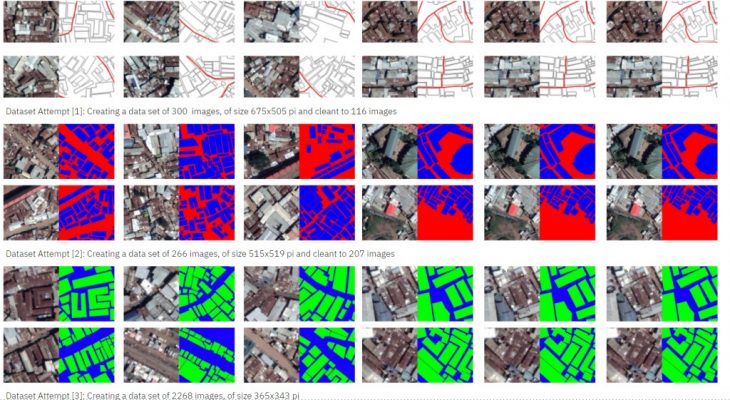
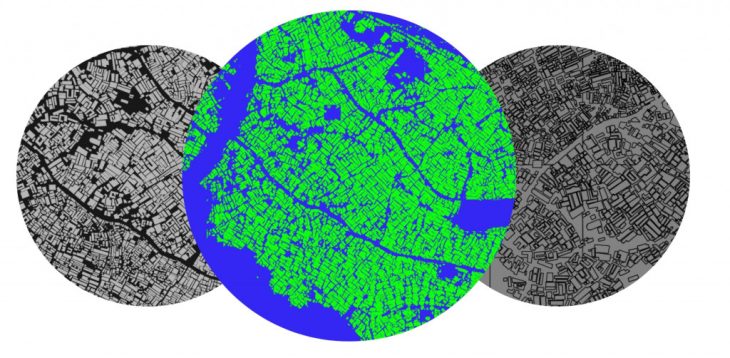
Vectorized map using pix2pix and QGIS
02-PARTICIPATORY MAPPING
So once we have the vectorized data or the shapefiles, we can build the participatory mapping platform on top of it. For that purpose, we created a web app where the users or the NGO can draw a point, use lines as paths or polygons to mask certain areas. This platform is easy to use and accessible through a mobile device or laptop which also has geolocation. All this information is stored in a cloud database which is accessed by our machine learning model and grasshopper.
Visit the website using this link.

[POINT NODES] •Toilets •Emergency Services for fire •Transport facilities Bus and Railway Stations •Waste Management •Water Supply

[LINE PATH] •Hierarchy of streets: Primary, Secondary, Tertiary •Accessibility by the size of Vehicles: Bikes, Cars, Trucks, Ambulances •GPS Trackers to track the movement of residents
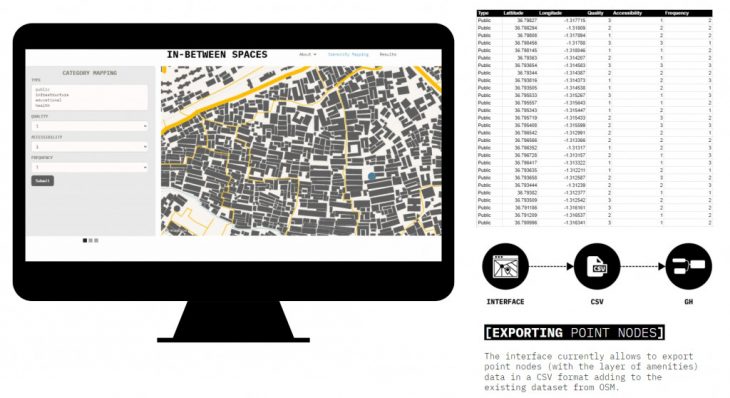
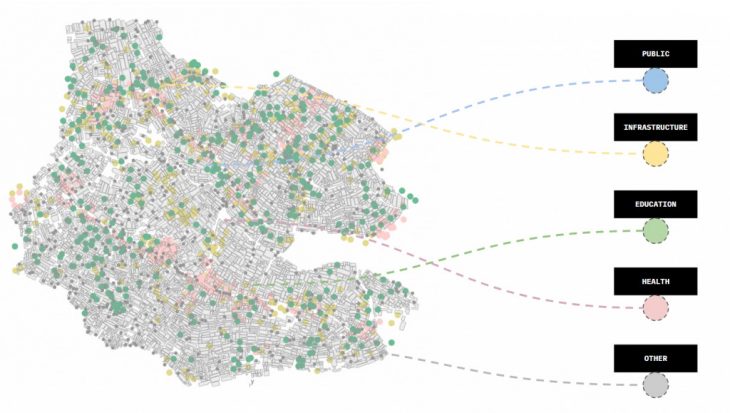
When mapping, we ask the user to fill out a form that collects extra information such as what is the type of space – public, educational, entertainment, and various rating metrics such as quality, frequency of visits, and accessibility.
03-MACHINE LEARNING
After we`ve collected all this knowledge, we want to match it to the few empty spaces that we’re able to find in these very packed locations. We`ve devised a script that travels through the settlement searching for them. Once one is located, we give it an ID so that we can retrieve it later.

EMPTY SPACES FINDER

ASSIGN AN IDENTIFIABLE ID

IDENTIFYING EMPTY SPACES
After we overlap them with the community nodes collected before, the question becomes: how can we create a relationship between the known places of this community and the empty spaces awaiting activation. The labels you see here can be changed, so it’s really a flexible process. But for now, you can think of them as public space-related activities, infrastructure like waste and toilet access, education as schools and workshops, and so on.
OVERLAPPING COMMUNITY NODES
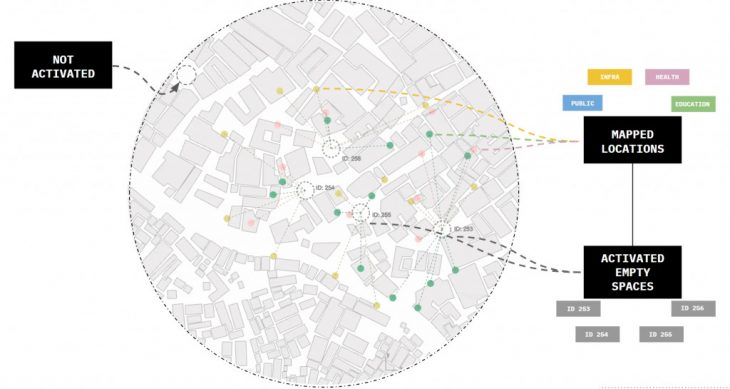
We know that some of these locations might already be signaled by the NGO because they are knowledgeable of the territory, but what about all the others we found? Could we find a way to generalize the knowledge of collective mapping to these new locations?
Our process is about this connection, transferring the knowledge we have of one, to the other, and activating the second. In case there are no mapped locations close enough to a certain empty space, then that empty space will not be activated.
LEARNING FROM THE COMMUNITY
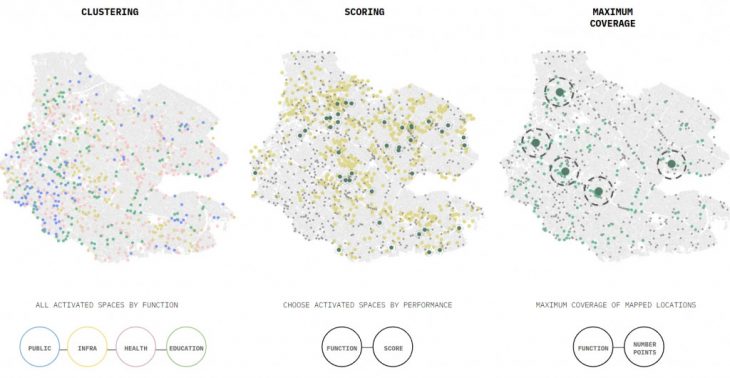
For that, we chose to implement a classification model because of how flexible it can be. We generated thousands of points on our map and trained to match them to the IDs of empty spaces, effectively predicting with high accuracy to which empty space any new mapped location should relate. The beauty of choosing a machine learning model over brute computation is that we can use much more than the distance to establish the relationship between these two classes. Aspects like how a function is appropriate to certain morphologies of space, or not, can be fit into this categorization model, expanding it to the intentions of the NGO. For example, you can track playgrounds mapped information to always find empty spaces within big and safe areas. And through k-means, we can cluster these spaces into different groups, related to the goals of intervention of the NGO. Each group is guaranteed to have a certain performance across its elements which can help identify similarity patterns
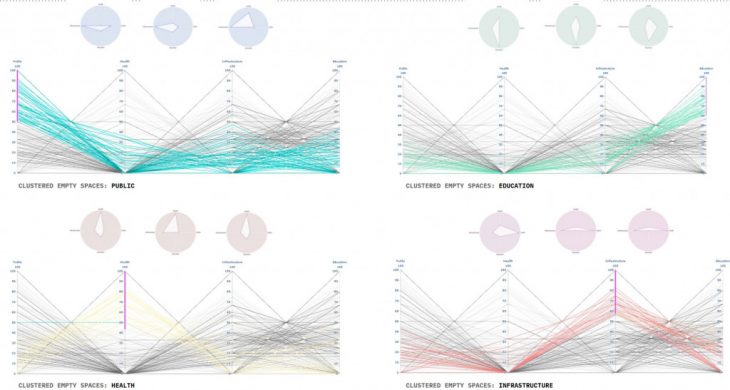
CLUSTERING EMPTY SPACES
On the backend, this is how things are working. We first collect information on metrics and type of mapped locations on the website, and to each of those, we assign them to the related empty space and transfer the knowledge over. This gives us an identity for each that we can cluster, and then make available for the NGO to sort, pick and filter as desired, returning the spaces that will be activated for the street network.
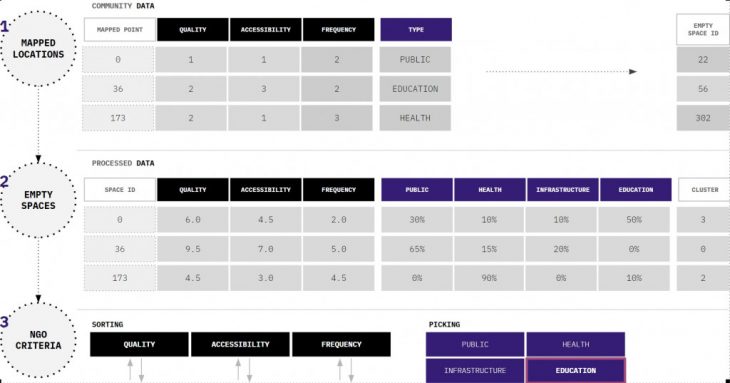
We offer 3 ways of doing this: one is giving access to the cluster, activating spaces all across the settlement, another method is to rank the spaces across the intended metrics, and finally a little bonus, a greedy algorithm that maximizes coverage of mapped locations
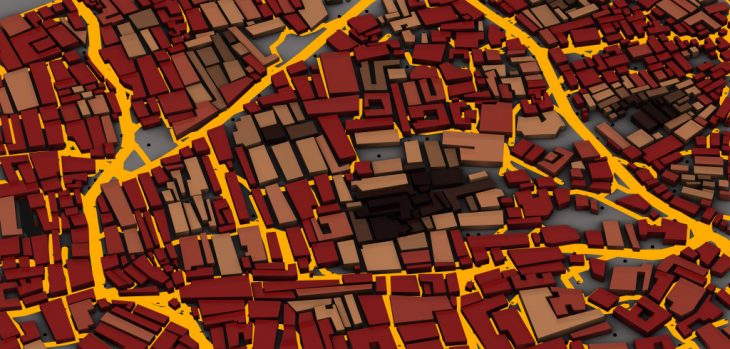
04-STREET NETWORKS
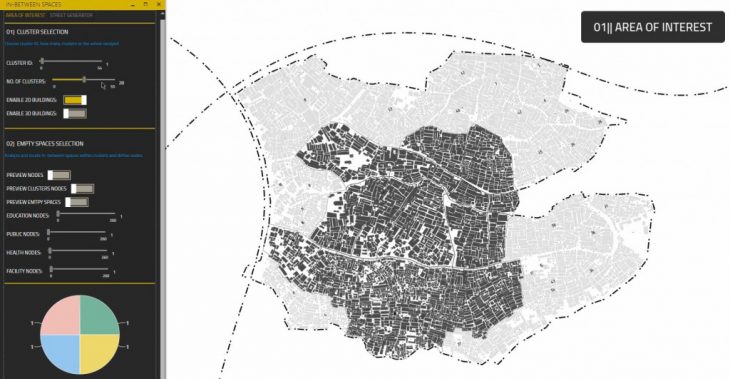
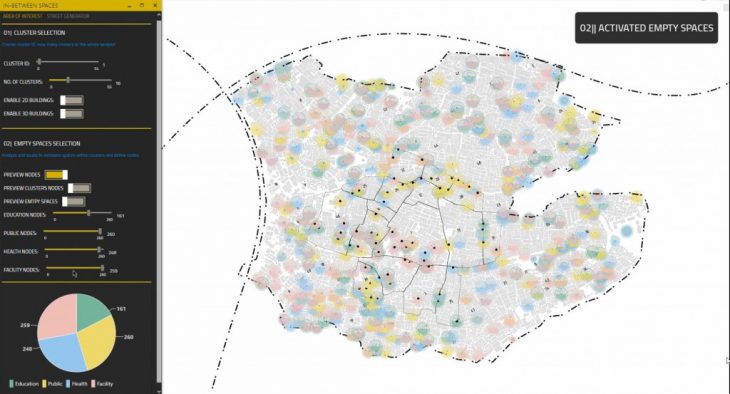
The user interface inside Grasshopper3d is divided into two parts; the first tab where the user can control the selected area within the settlement, visualization options, preview empty spaces, activating nodes using the machine learning model, and show nodes charts. The second tab where the user can enable streets network calculations, generating minimal paths network, generating shortest paths network, choose between streets iterations, apply buildings analysis, apply betweenness centrality, apply closeness centrality, and export results to Mapbox.
[04-A] Area of interest
The user can choose clusters ID, and how many clusters to be analyzed.
[04-B] Activating empty spaces from the ML model using Hops component
After training our ML model, the user can control how many nodes should be assigned to different activities using the Hops component.
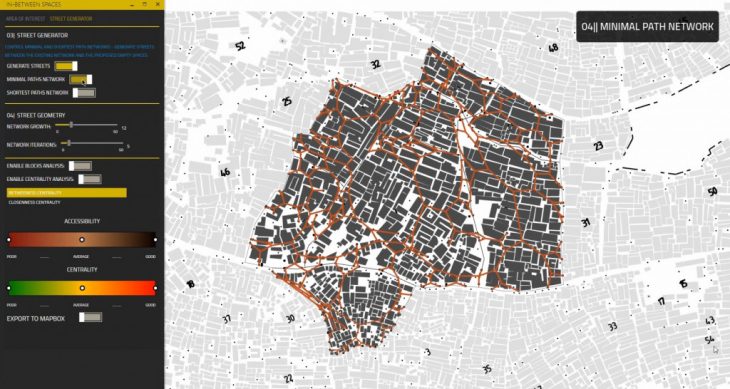
[04-C] Minimal Paths Network
To generate streets that connect different buildings with the activated nodes, first a minimal path network is created to optimize the walkable distance within the settlement. These network lines are used later as desired destinations to generate shortest paths networks.
[04-D] Shortest Paths Network
The street network is created based on the minimal paths network. The user can change the network parameters, and the streets will only grow to avoid collision with buildings.
![]()
[04-E] Accessibility Analysis
Using our script the user can analyze the walkable distance from the generated street work to different buildings. The result is a metric for how many buildings are accessible and how many buildings are not.
![]()
[04-F] Closeness and Betweenness Centrality
To be able to compare between different street network alternatives, the number of people walking in these streets (Betweenness Centrality) and the frequency of using streets (Closeness Centrality) are measured and visually represented to the user with a range from poor to good centrality.
![]()
[04-G] STREET NETWORK PROCESS VIDEO
</p>
05-WEB INTERFACE
After creating a user interface where we can control the generative analysis through Grasshopper. We also created a web-based method to control the Grasshopper parameters by inserting the main values through our website Settings button.
Visit the website using this link.
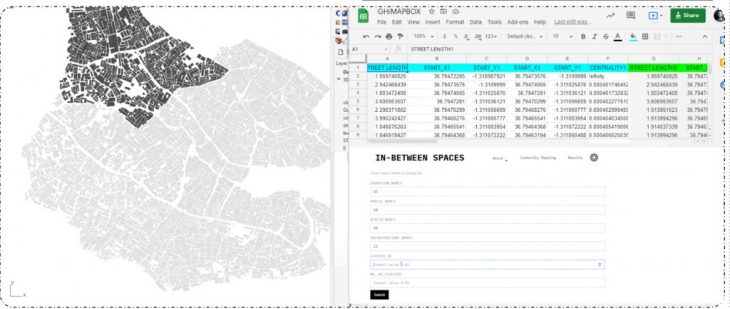
Basically directly on the web, the user can insert the id of a cluster of interest, several clusters, what category of empty spaces, and their number, which will go to Google sheets live and grasshopper and from there go back live on the website. So in a matter of 3 minutes even if you go on our website now the results for Street Networks 1 can be changed by your interesting values in the settings menu.
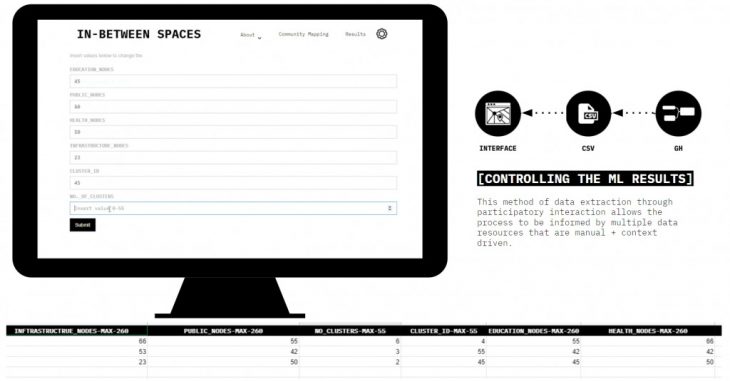
All the data that has been collected from the community can be compared with the activated spaces from the AI model and the generative Grasshopper street networks and empty spaces. The whole process is created through this simple loop from the web to Google Spreadsheet and back and as long as our Grasshopper script is running the process in real-time.

CREDITS
IN-BETWEEN SPACES is a project of IAAC, Institute for Advanced Architecture of Catalonia developed in the Master in Advanced Computation for Architecture & Design in 2020/21 by Hesham Shawqy, João Silva, Polina Hadjimitova, and Varun Mehta. Faculty: Angelos Chronis and Lea Khairallah.
