I-Spy is a generative prototype tracking meter which enables the user to determine the distance he or she travel in an hour, day, month or a year. The following generative acts a general track meter to visualize or understand how many hours of day or a year a person spends in a single place. This generative spy prototype is extremely useful as it helps in tracking vertical distances also to help understand the vertical distances in their travel catalogue.
A person starts his or her day while going to work, doing cumulative chores throughout the day, spending additional time at unwanted places, spending time in travelling, sitting idle at a single place and lots more.
This generative along with visualizing the tracking , can be incorporated with the factor of time to battle unwanted stops in a day time. a person can calculate how much time he spends in a day while travelling, how much time does a person spend in a supermarket, how much time does he spend while working, how much time does he spend in recreating, how much time is utilized in travelling at unwanted short notices. This generative is useful for determining a generative of more than one individuals for comparing the time spent between different individuals.
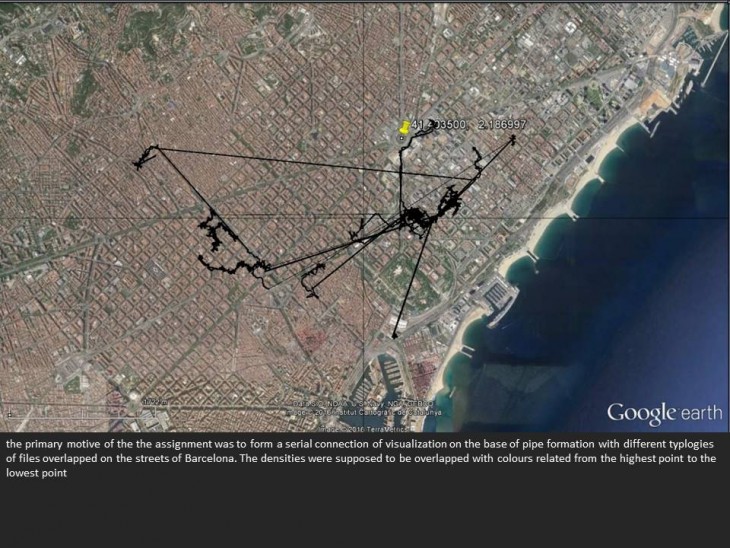
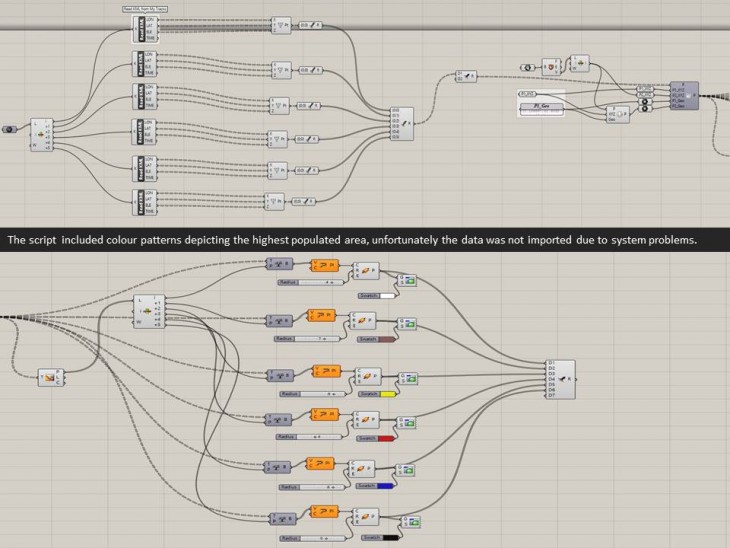
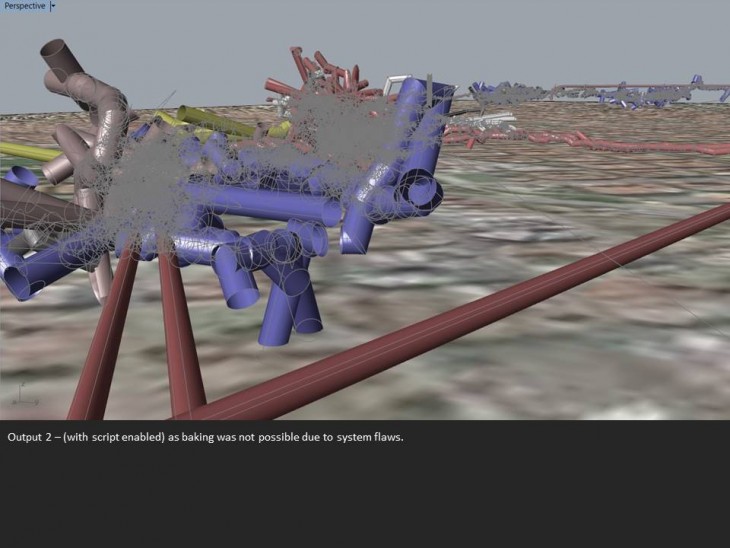
the overall motto of the assignment was to create a visualizing generative of travel locations and see the outcome on time comparisons and was to form a serial connection of visualization on the base of pipe formation with different typologies of files overlapped on the streets of Barcelona. The densities were supposed to be overlapped with colors related from the highest point to the lowest point.
The particular representation can be changed to multiple options and alternatives of representation to clarify what a user eventually want to see and under how many alternates does the user want to visualize the output.