Abstract
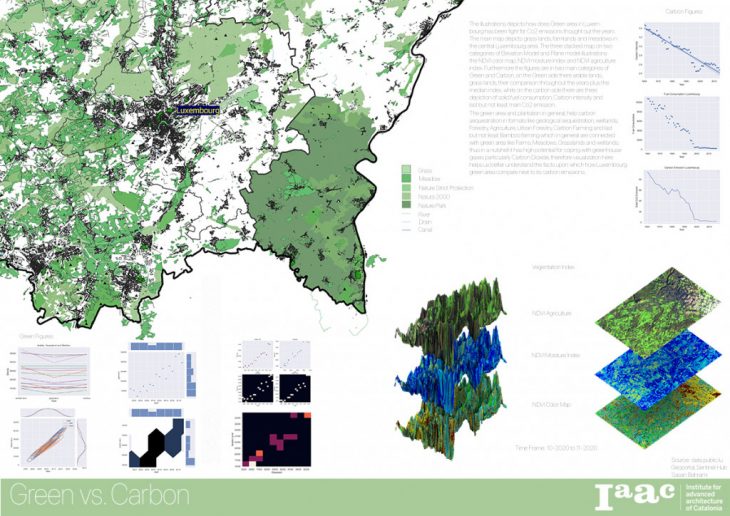
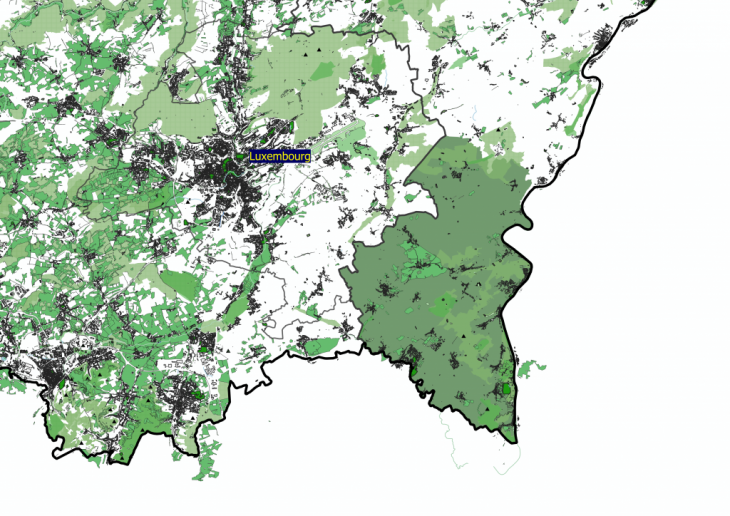
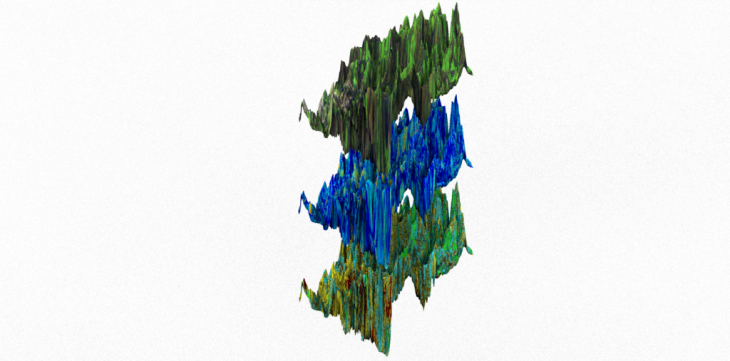
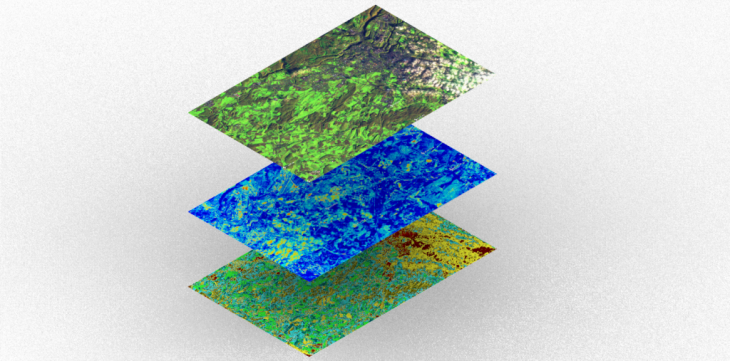
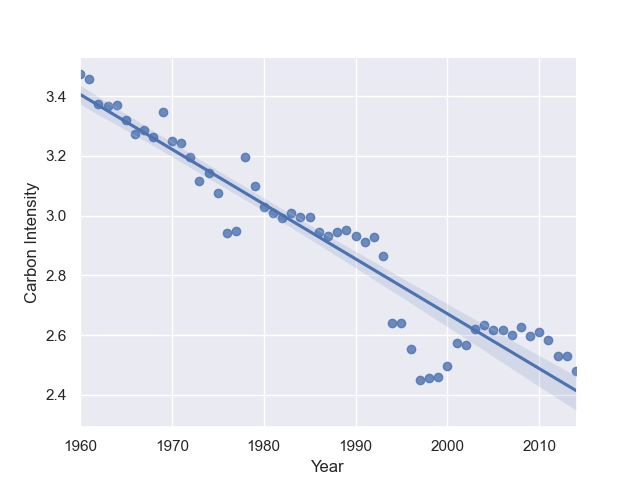
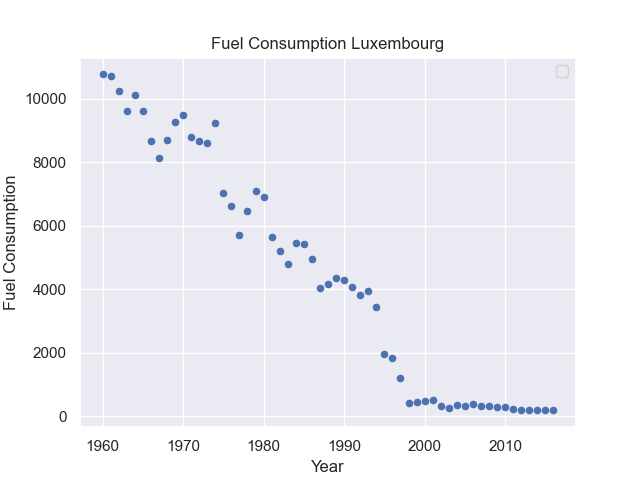
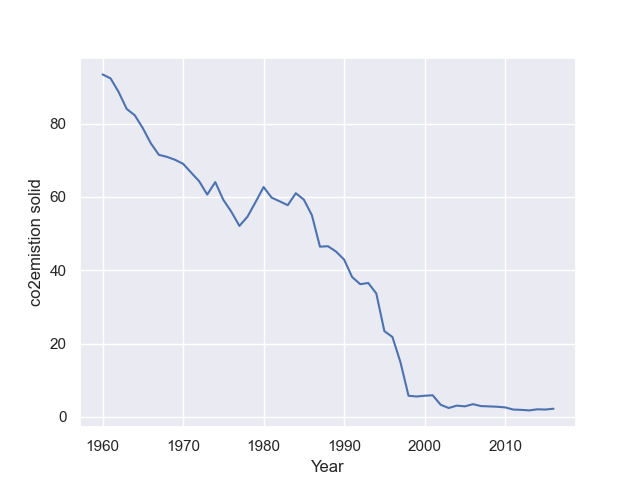
The illustrations depict how does Green area in Luxembourg has been fighting for Co2 emissions thought out the years. The main map depicts grasslands, farmlands, and meadows in the central Luxembourg area. The three stacked maps on two categories of Elevation Model and Plane model illustrations the NDVI color map, NDVI moisture Index, and NDVI agriculture index. Furthermore, the figures are in two main categories of Green and Carbon, on the Greenside their arable lands, grasslands, their comparison throughout the years plus the median index, while on the carbon side there are three depictions of solid fuel consumption, Carbon intensity and last but not least main Co2 emission. The green area and plantation in general, help carbon sequestration in formats like geological sequestration, wetlands, Forestry, Agriculture, Urban Forestry, Carbon Farming, and last but not least Bamboo farming which in general are connected with a green area like Farms, Meadows, Grasslands, and wetlands, thus, in a nutshell, it has a high potential for coping with greenhouse gases particularly Carbon Dioxide, therefore visualization here helps us better understand the facts upon which how Luxembourg green area compare next to its carbon emissions.
 .
.
Implementation:
On the figures data has been retrieved from geoportal of Luxembourg and Luxembourg open data portal, then forked and categorized to be used with Pandas, Seaborn, NumPy, and Matplot.
On the main map, the open data from the Luxembourg portal has been filtered on grasslands, rivers, wetlands, buildings, meadows, farms, grasslands, administrative borders, and canton borders combined to create the map on open source GIS software QGIS.
The NDVI maps have been retrieved from Sentinel Hub on three different types of NDVI color map, NDVI Agriculture map and NDVI Moisture Index from Sentinel-2-L1C from 2020-10-10 21:54:06 to 2020-11-10 21:54:06. The API has been connected via WMS through QGIS and layer configured at sentinel hub portal, then the data exported with an ASC translated file out of an Elevation model of a site retrieved from Luxembourg open data, all together imported into Grasshopper for terrain and rendered in Rhino.
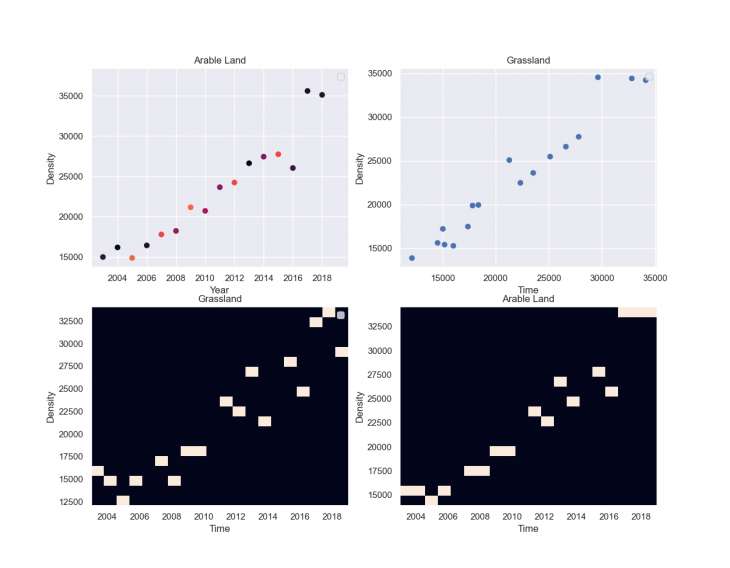
Carbon Emission Figures
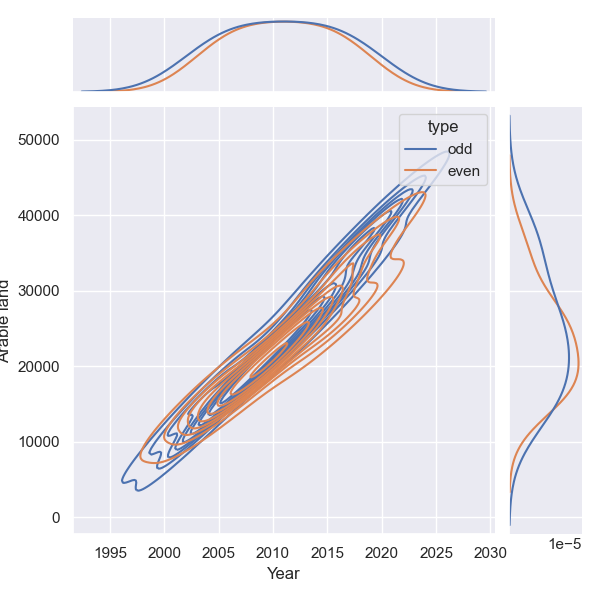
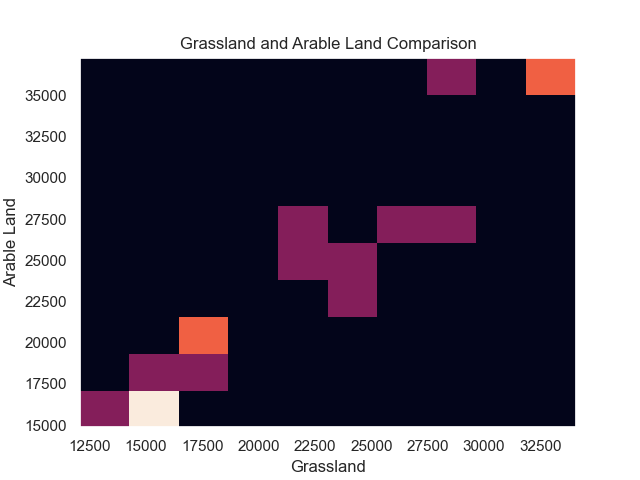
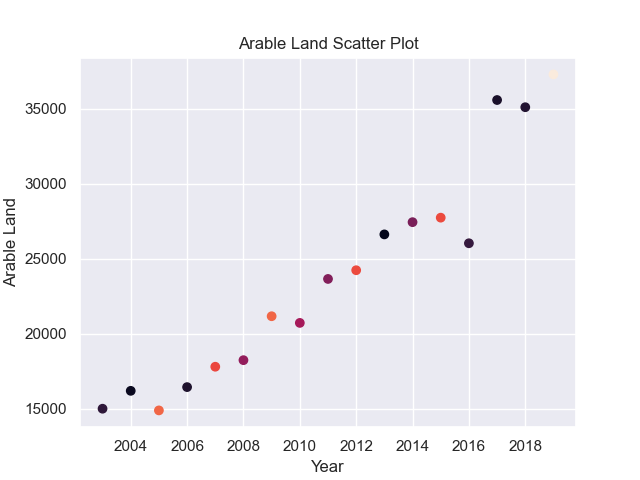
Green Figures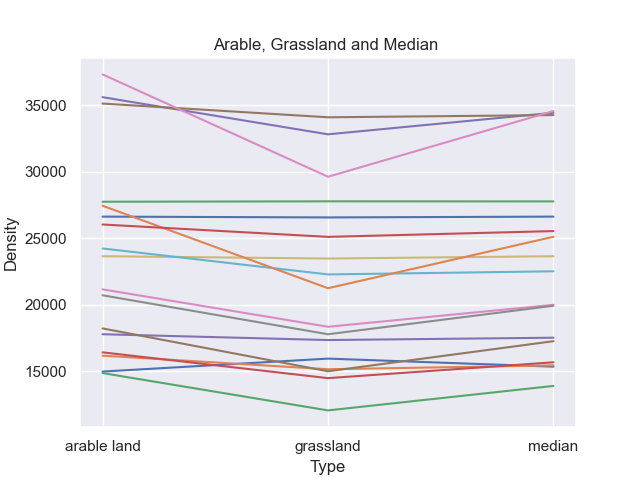
Data source: Luxembourg Georportal and Luxembourg Public Data
Carbon vs. Green is a project of IAAC, Institute for Advanced Architecture of Catalonia developed at
MaCT in 2020/21 by students: Sasan Bahrami, and faculty: Diego Pajarito.