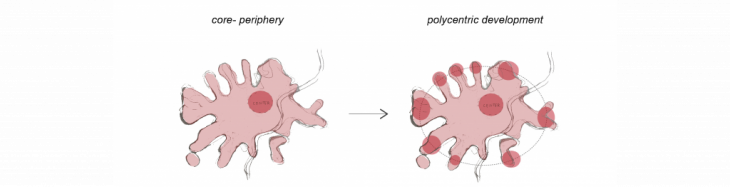
Food centrality or food policentrality?
Shanghai is developing rapidly: it is already the biggest city in the world in terms of population. The suburbs of the city are already clustering because of long-term immigrants. Taking it into the consideration, the city government is working on a masterplan to create polycentric Shanghai. But where is nowadays the center? What are the variables which can help to detect centrality? Can we measure centrality through daily activities? Is it possible to detect centers through the perspective of food?
Finding 4 centers – a matter of variables
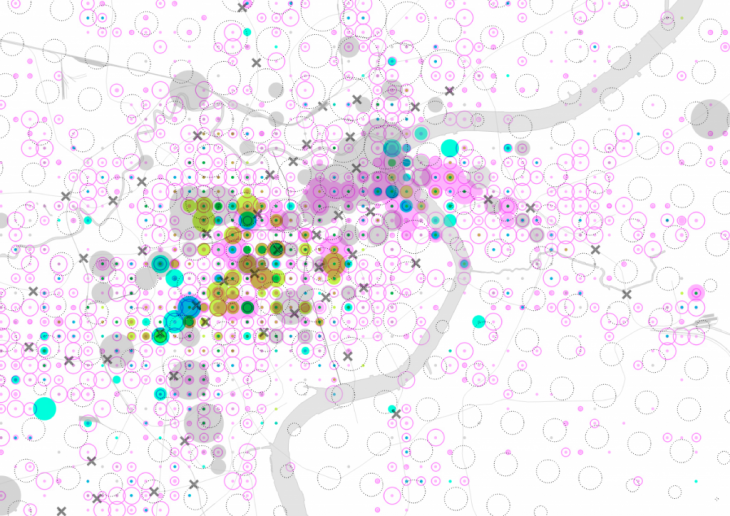
In this course we have worked with datasets from Tripadvisor, Meituan, Dianping and Bonapp, which contain different levels of information on food for the city of Shanghai (delivery, categorized places, opening hours, pricing, rating and reviews, etc.) and with OSM, which also includes a large amount of information on the city.
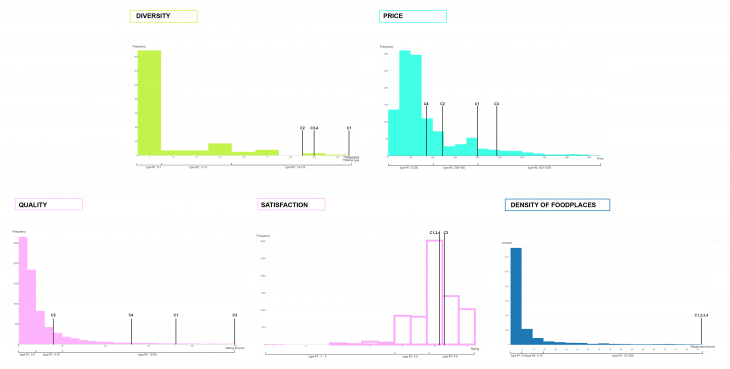
To be able to analize the city looking for possible food centralities, we have isolated 5 major variables: princing, quality, satisfaction levels, density of food places to go and diversity of cuisine. After mapping this variables through space analysis techniques, we have looked into their distribution using histogramms. This enables to see the frequency of specific range of values. The next step is based on both a visual approach to identify centers and a data-proved exercise to assign different centers specific values.
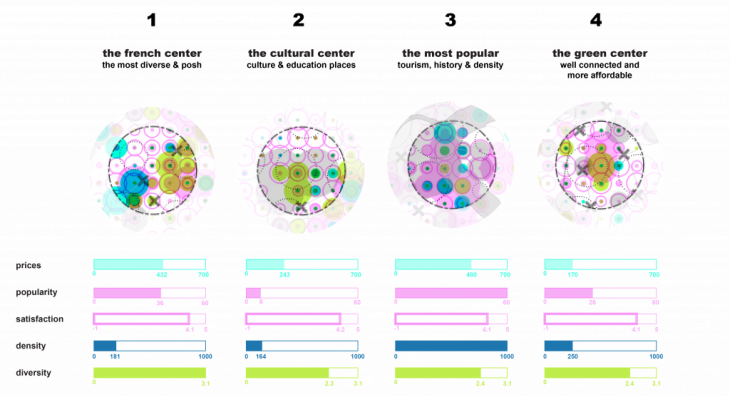
After doing so, we extracted four main categories which we tried to assign a name according to its specificities and also to its urban environment that we checked with baidu maps: the french center, the cultural center, the most popular and the green center.
From centrality to pluricentrality
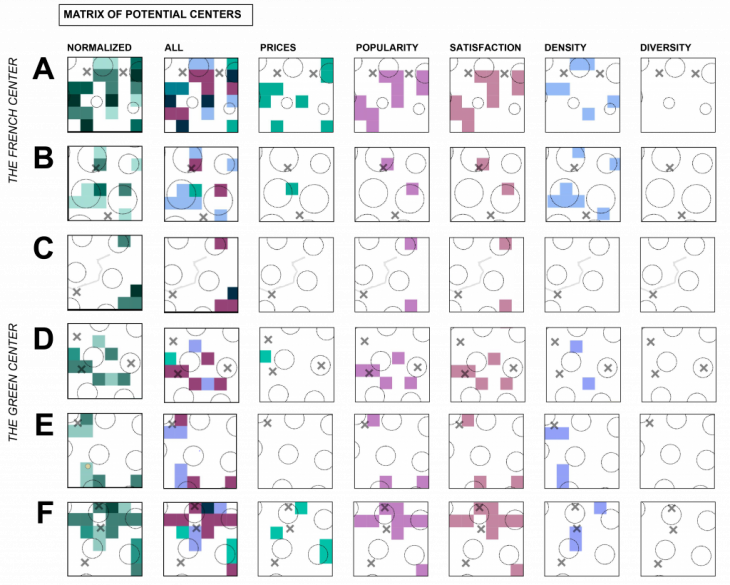
In this part we focus on two centers: “The french center” and “The green center”. Taking these into account, where can we find potential new arising areas with similar features? To answer this question, a series of maps have been done following these 2 steps:
- first, we draw the maps by filtering the variables only showing the range of values that actually define the centers (callibration)
- second, we normalize the visual appearence by using one single color to express all the variables;thus, it is a matter of color contrast to understand where in space these variables have a greater impact.
![]()
After doing this, we are able to extract potential centers. We pick 3 possible ones for each and again we break them down into layers to see the spatial distribution of the impact of each variable. This helps to detect opportunities.
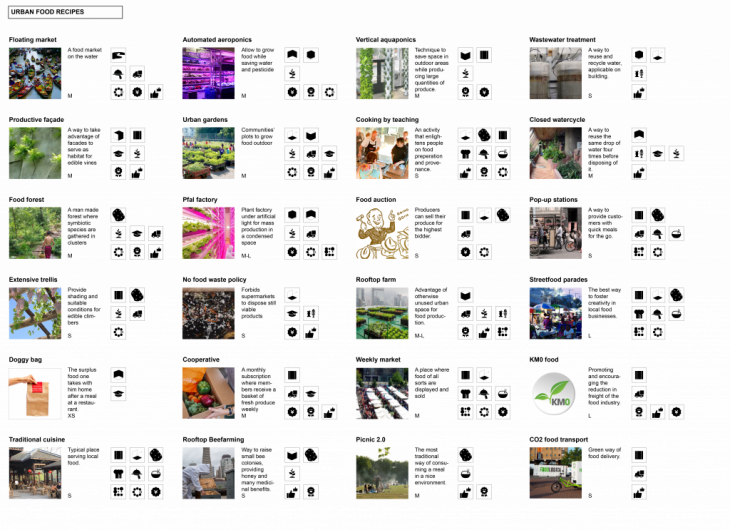
Urban food recipes
The last part is based on trying to find a system to find matrix of “urban food recipes” to implement in these analyzed spots to help them develop into food policentralities.
The system is divided into 3 major categories: “position” defines the location of each solution (building rooftop, façade, basement, park, street, river, etc); “activity” shows what is going to take place (food growing, cooking, serving, consumption, delivery, waste treatment, etc); finally, “variable” shows which of the considered variable is tackled by implementing each solution.
![]()
The matrix of “urban food recipes” shows a diversity of solutions that range from innovative and high-technology-centered options that have been proved to be potentially very efficient, to traditional ways to activate public space and foster programme diversity.
Finally, we prove their effects on the urban space by a series of collages that show the athmosphere created by some of the recipes.

Food Policentrality is a project of IAAC, Institute for Advanced Architecture of Catalonia, developed at MaCT (Master in City & Technology),
2017-18 by:
Students: Saule Gabriele Petraityte, Camille Feghali and Alba Alsina Maqueda
Faculty: Pablo Martínez and Mar Santamaría