DUNES
DYNAMIC URBAN NODES EMOTION SIMULATOR
A workflow that investigates the quantification of citizen’s emotions for the design and planning of dynamic urban environments through the development of a simulation tool
ABSTRACT
With Parc de la Ciutadella in Barcelona as a case study, this research project investigates the potential of extracting emotions ( Safety, Comfort and Health) through text data from review based social media platforms. By implementing Natural Language Processing techniques as well as the development of a Classification and Regression Analysis model trained by a public web survey, the emotions are quantified through the identification of causal relationships between urban indicators related to Accessibility, Visibility, Circulation and Infrastructure. The machine learning models are then integrated into a digital workspace where the selected urban indicators are able to be manipulated in order to predict the emotion landscape. The result of this research proves the potential to evaluate and simulate emotions by using quantified data from the urban environment.
FRAMEWORK
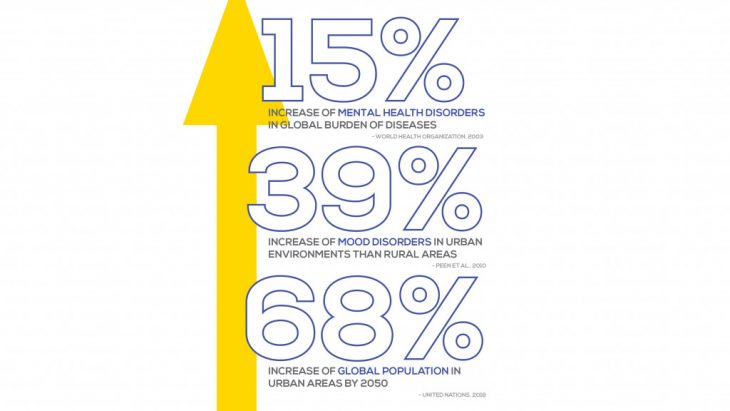
The United Nations projected that by 2050 there would be an increase of 68% of the global population in urban environments. In the context, of this research, this rise would affect the state of mental health disorders of urban citizens as there have been research that has shown that there are significantly highers risks of mood and mental disorders in urban environments. Also, with the World Health Organization predicting that by 2020 there would have been a 15% increase in mental health disorders in the global burden of diseases, there is a need to create more livable cities that enhance the mental well-being of citizens.
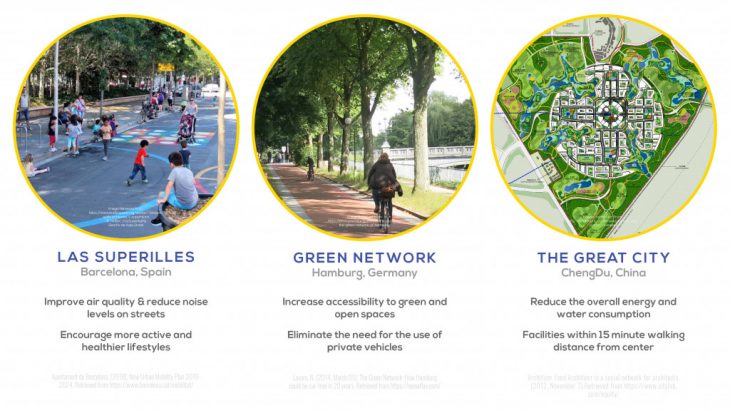
Many cities have already realized this and have implemented strategies such as pedestrianization to create better urban environments. Looking at different scales of urban interventions and planning, the objectives of these projects are to create better city environments to improve overall health.
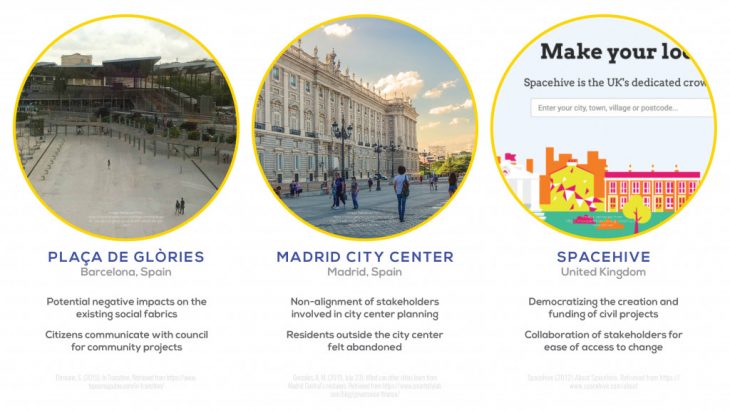
In designing and planning livable cities, the most vital component is citizen engagement. These case studies look at the importance of the role of communities in facilitating urban design initiatives such as in Placa de Glories or on the flip side, in Madrid, where the citizens outside of the planning area felt that they did not benefit from the “greening” plans due to non-alignment of the stakeholders. In the case of Spacehive, the community has taken the reign in funding and implementing civic projects while involving the city council.
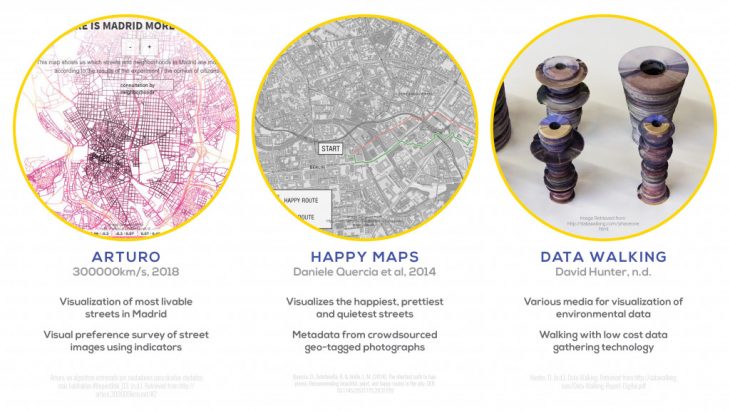
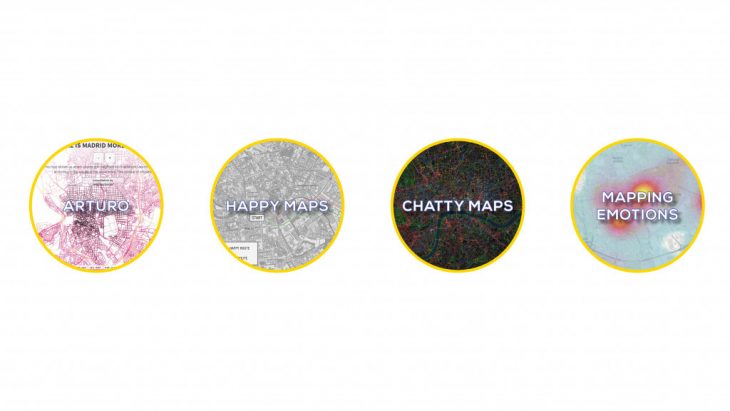
Besides engaging the citizens, we need to understand the quality of the urban environment we are designing. These case studies look at various visualization techniques that map various urban parameters such as livable streets in Arturo or qualitative aspects of the area such as in Happy Maps. Non-conventionally, Data Walking uses other methods of visualization techniques such as artefacts in order to map the environment through walking.
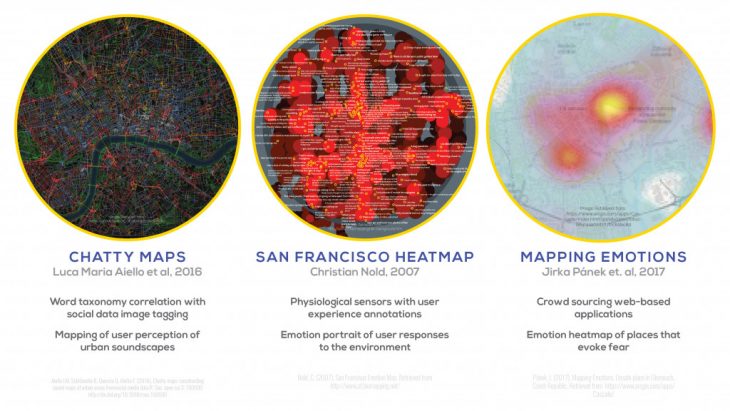
In parallel, we need to understand how people perceive space in order to design the environment that they inhabit. These case studies look at various data collection techniques to visualize user perception of space using digital environments or physiological sensors to extract biological data.
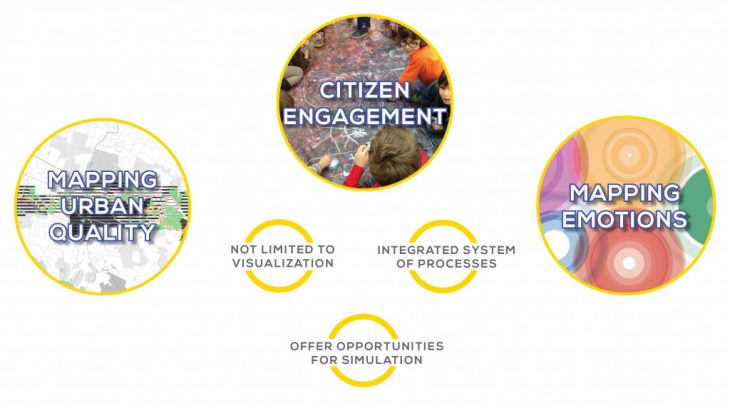
In order to aid decision makers in designing livable cities for mental well-being, we need to implement strategies that engage citizens to derive urban qualities with their perception of space without limiting it to visualization techniques, ensuring an integrated system of processes and offers opportunities for simulation.
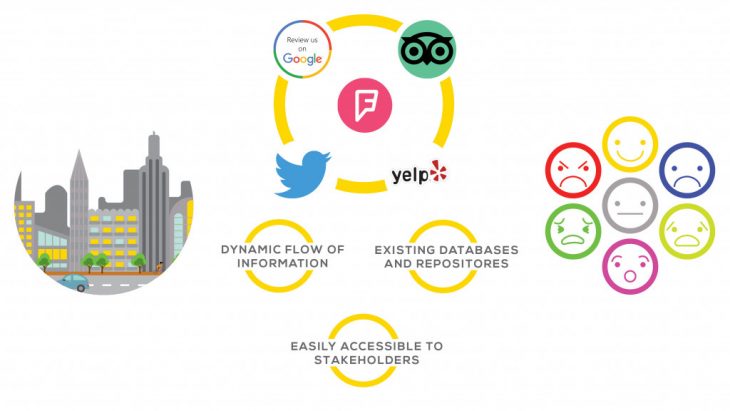
By looking at Volunteered Geographic Information, we could begin to piece everything together because of the dynamic flows of information with regards to the cityscape and individual perception. There are also existing databases and repositories to take advantage of that is also easily accessible by all the stakeholders involved in the urban design process.
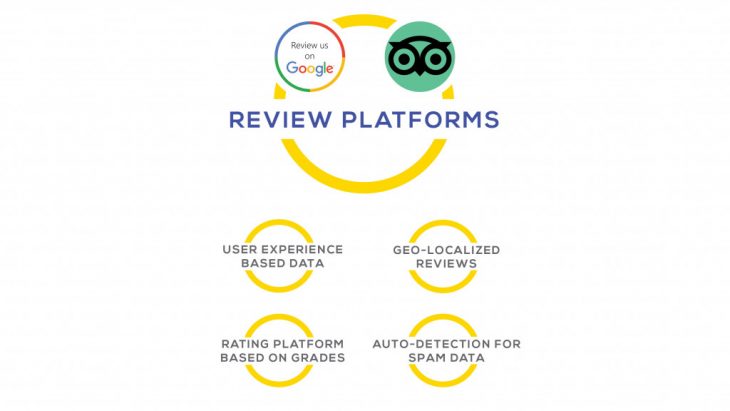
Within the context of DUNES, this workflow focuses on review-based social media platforms such as Google Reviews and TripAdvisor ( though the methodology could be implemented with various other platforms ). This form of social media offers user experience based data complemented with ratings from a graded scale and all this information is geo-localized.
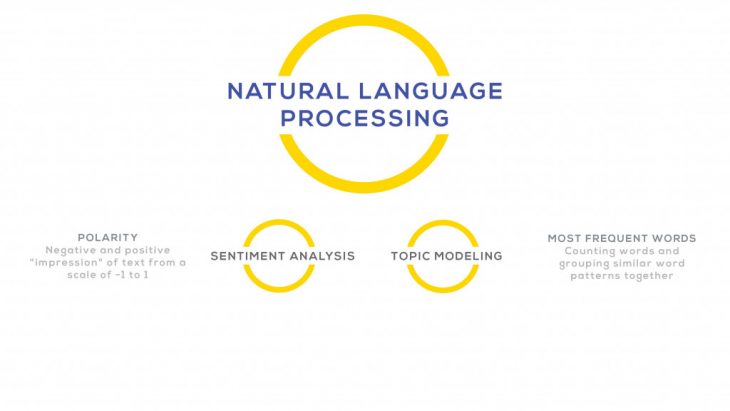
In order to analyse the text reviews, DUNES explores the potential of natural language processing techniques of sentiment analysis and topic modeling in order to derive quantitative values from polarities and most frequent words to inform design decision making.
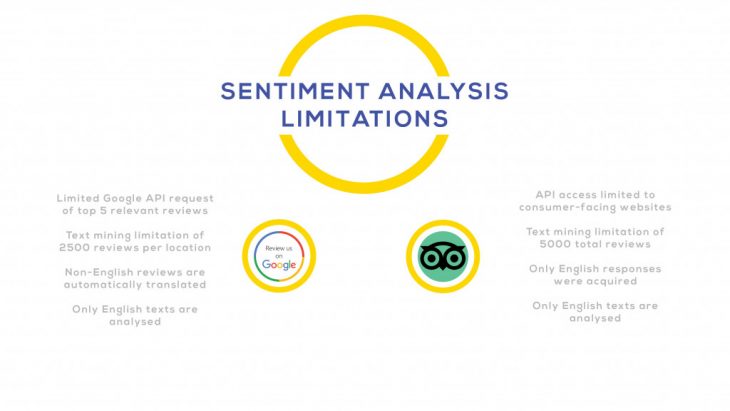
However, these platforms have limitations especially in terms of accessing the database of reviews. With regards to the analysis, sentiment analysis has more accurate results with only English texts.
DATA VALIDATION
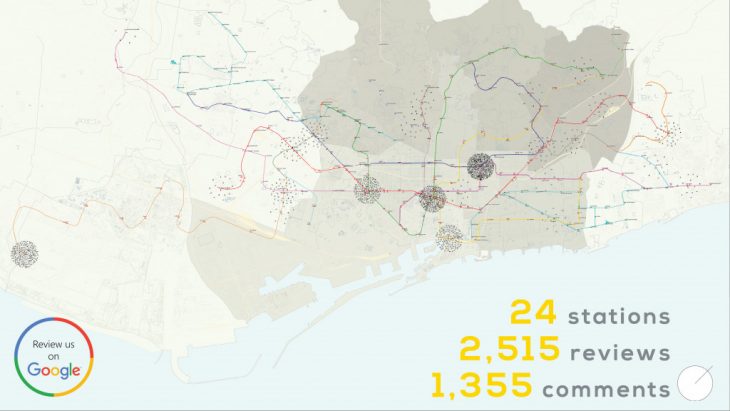
In order to test the credibility of review-based social media platforms, a validation experiment was conducted using Google reviews looking at the context of mobility in Barcelona focusing specifically on the Metro Stations. With 24 core stations, a substantial amount of text data was obtained which proved sufficient for analysis.
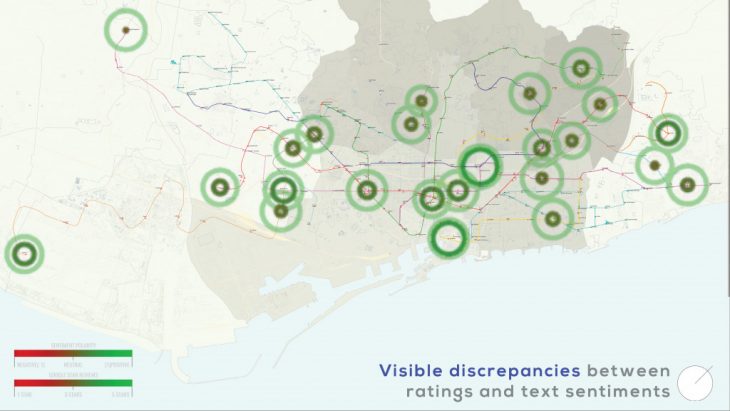
When the Sentiment Analysis was conducted, there was a visible discrepancy between the average polarities of the comments and the Google rating. This meant that the text data offered a higher resolution of information for analysis.
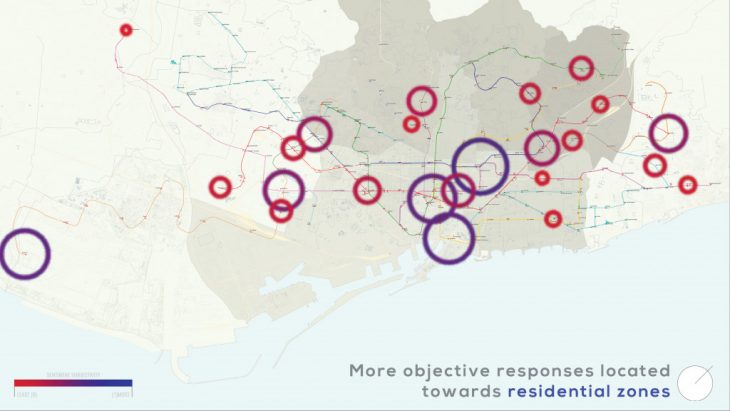
Besides that, we could also derive geographic inferences from the analysis such as when the subjectivity of the texts were analysed, we can see that the more objective comments and reviews were made towards the more residential areas of Barcelona.

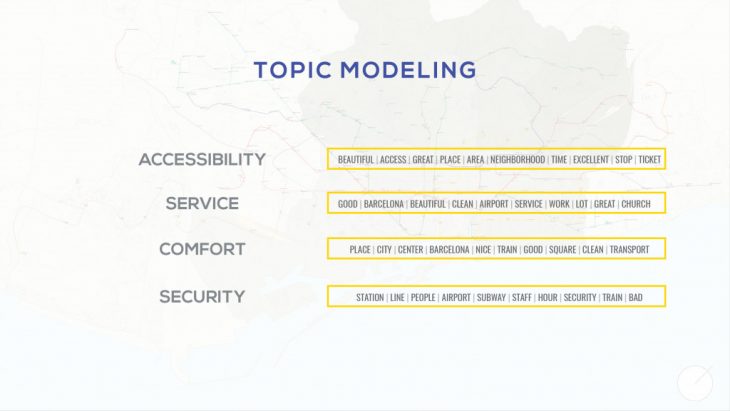
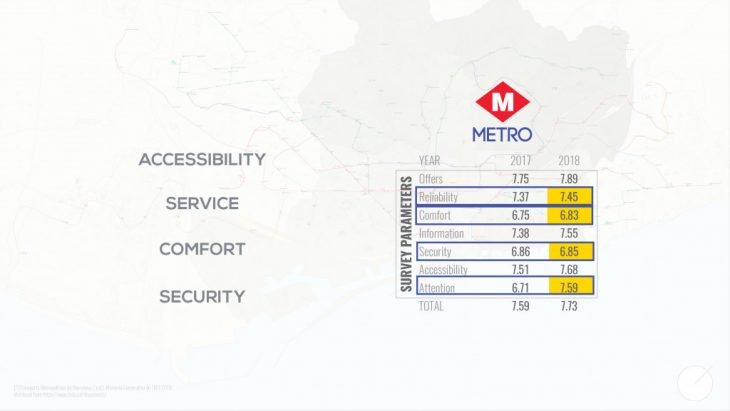
When Topic Modelling was conducted, it was seen that the most used key words could be grouped into four main categories which were accessibility, service, comfort and security. When these topics were correlated with the survey conducted by TMB Barcelona in 2019, it can be seen that the topics were the lowest rated. This experiment proved that review-based social media platforms through natural language processing can be used to conduct objective analysis.
DYNAMIC URBAN NODES EMOTION SIMULATOR
HYPOTHESIS
If Emotional Analytics (Qualitative Data) is correlated with urban indicators (Quantitative Data), sentiments in dynamic urban environments can be digitally evaluated and simulated.
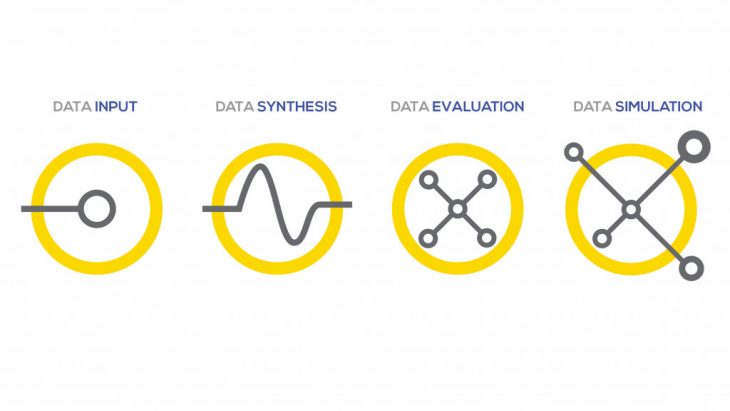
In order to test the hypothesis, DUNES was divided into 4 main phases.
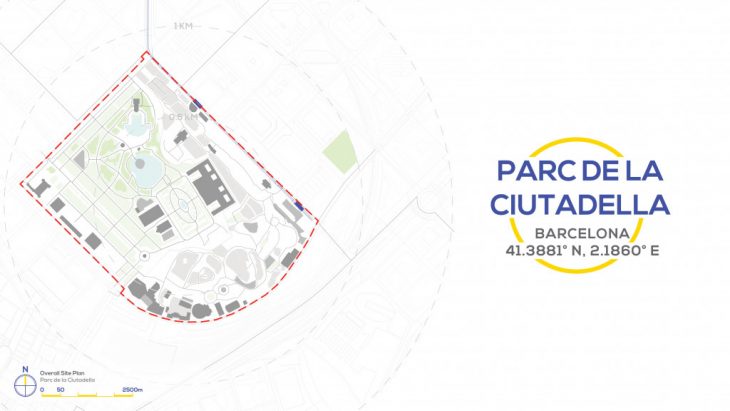
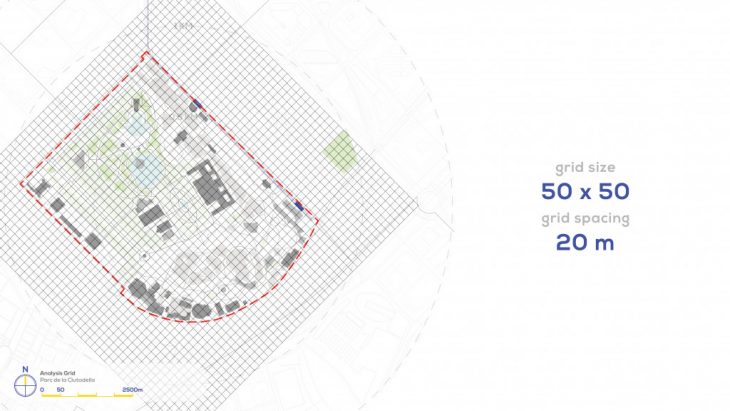
For a higher resolution of analysis, DUNES was conducted on Parc de la Ciutadella, Barcelona using an analysis grid of 50 x 50 with 20m spacing.
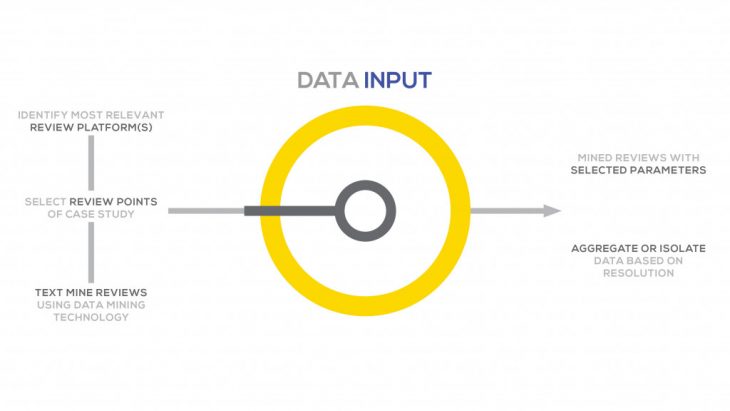
Beginning with Data Input, where geo-localized points of review of our case study were identified from various review platform(s) (Google Review and Trip Advisor). Through data mining, we have a text database with parameters of choice and depending on the resolution of study, we could either aggregate or isolate the data.
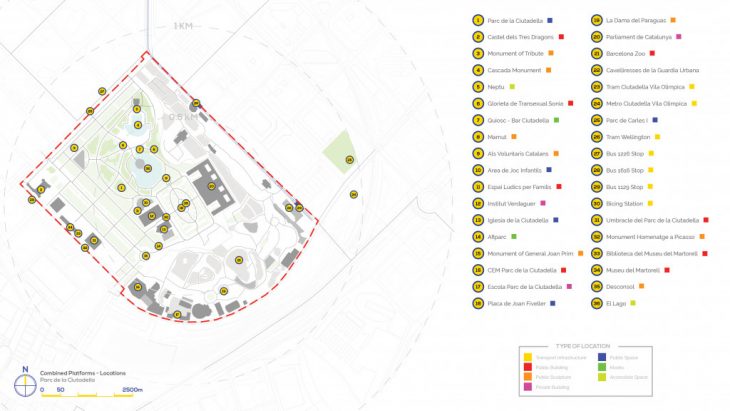
On Google Reviews and Trip Advisor, 34 and 13 geo-localized points of review were extracted respectively. Moving forward, the data was aggregated due to the similarities in the platforms as well as some overlapped geo-localized information forming a total of 36 geo-localized points of review in Parc de la Ciutadella, Barcelona.
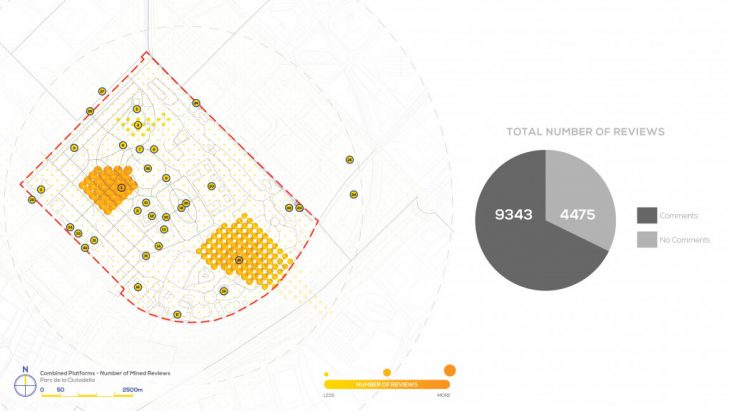
The text mining provided DUNES with a database of over 9000 texts to analyse most of which were rated positively on the review based platforms.
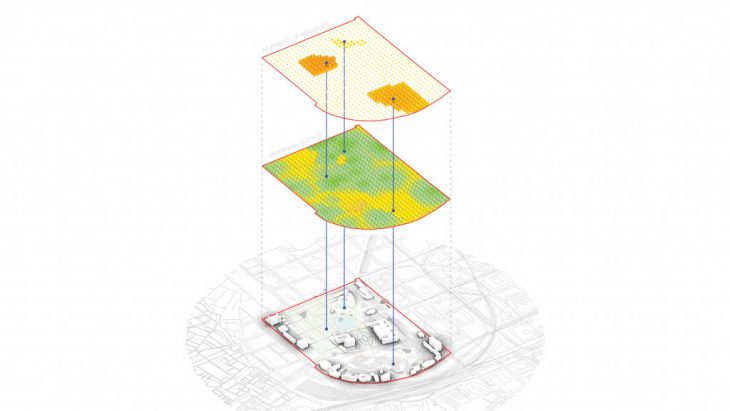
Through this initial data input phase, we can visualize hotspots of activity as visible here in the center of Parc de la Ciutadella, the main fountain and the Barcelona Zoo.
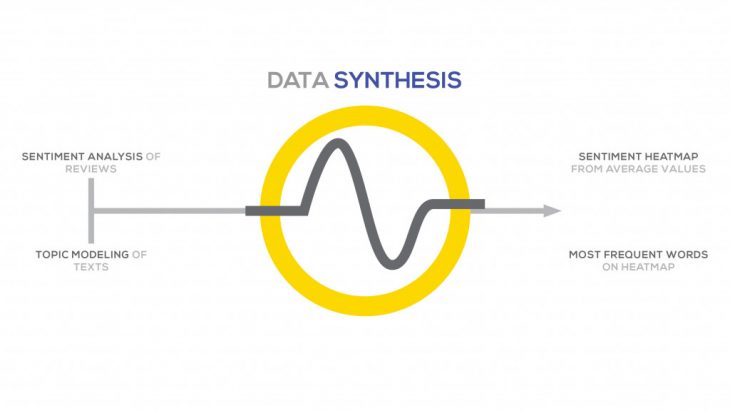
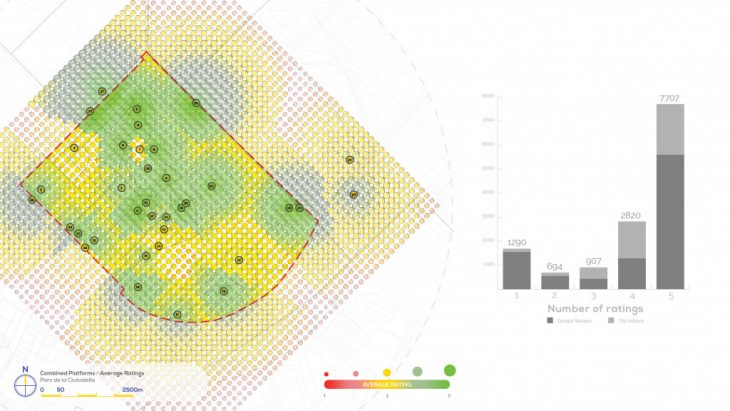
Once the text database is prepared, preliminary analysis through natural language processing studies can be conducted to derive higher resolution heatmaps as well as form inferences based on the most frequent words used.
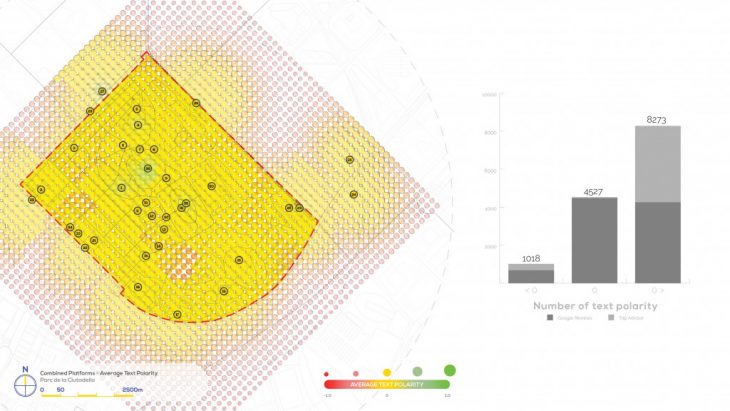
Through the Sentiment Analysis, we can see that the sentiments lean towards the more positive-neutral zones and when compared with the platform ratings, there is a huge discrepancy as seen by this calculation ( Heatmap 2 / Heatmap 1 = Value of Disparity ) = 3726.11 / 2659.83 = 1.401
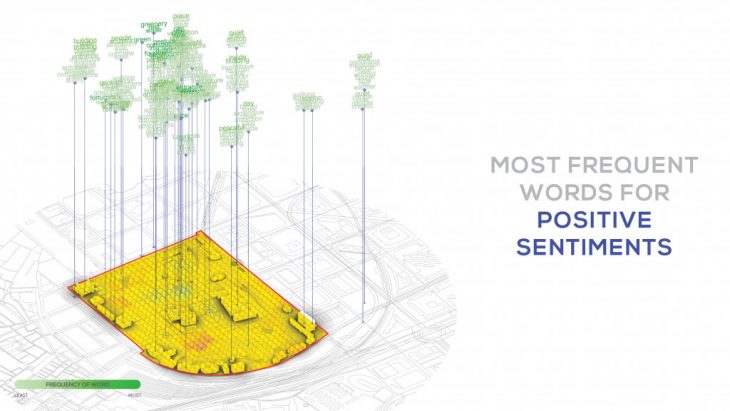
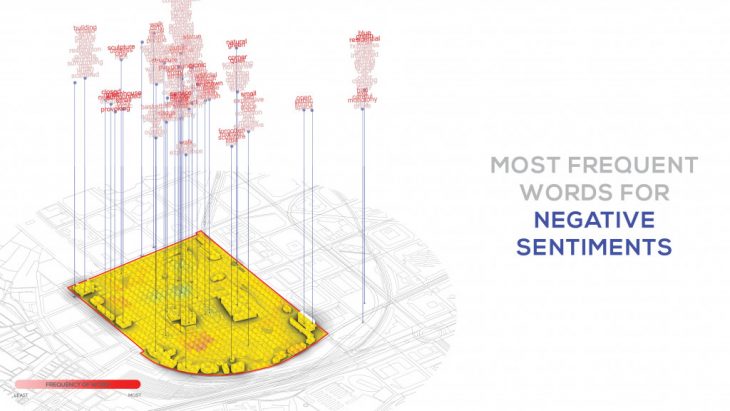
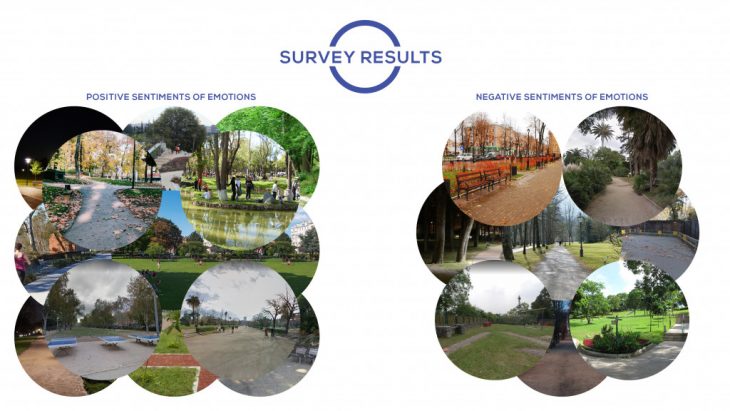
The most frequent words used for the positive and negative sentiments were also mapped to be view later (if necessary) in order to inform design decisions based on what the users comment about the most.
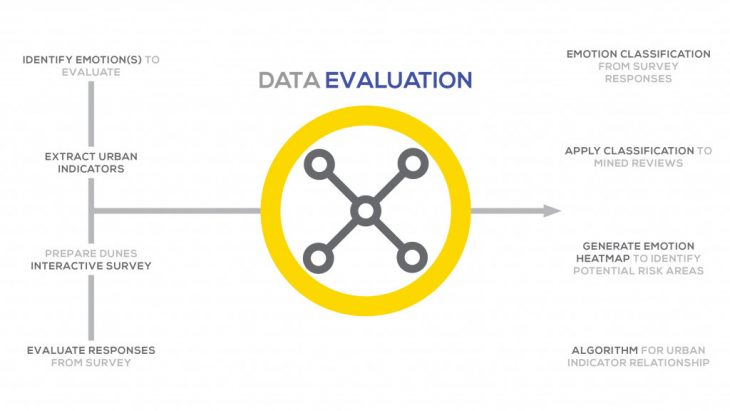
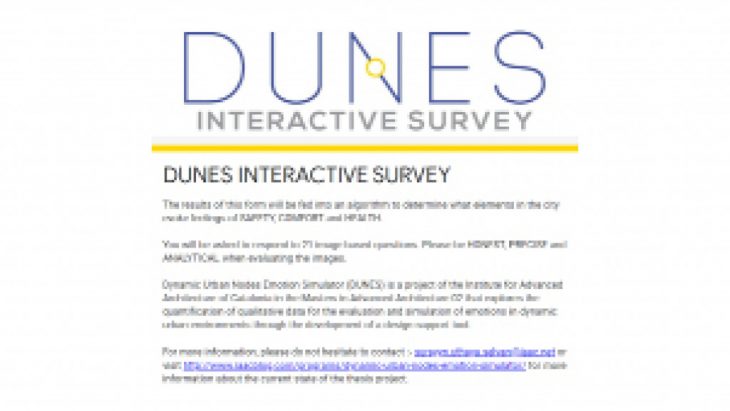
The core of DUNES relies on the outcomes of the Data Evaluation phase where the emotions that are intended to be analysed are identified along with the quantified data relevant to the emotions through urban indicators. To facilitate this process, DUNES proposes an interactive survey that trains a classification and regression model to generate a metadata heatmap.
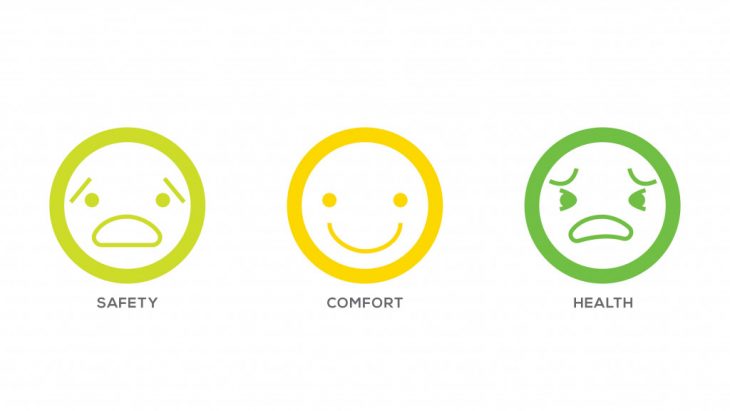
DUNES focuses on 3 main emotions:- Safety, Comfort and Health.
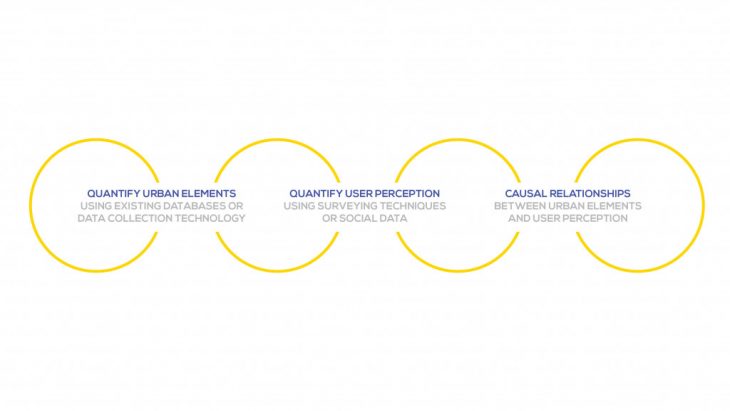
Through the previously mentioned case studies, it can be seen that urban elements can be quantified through repositories or data collection technologies, user perception can be quantified through surveying methods and social media data but most importantly, causal relationships can be determined between urban elements and user perception.
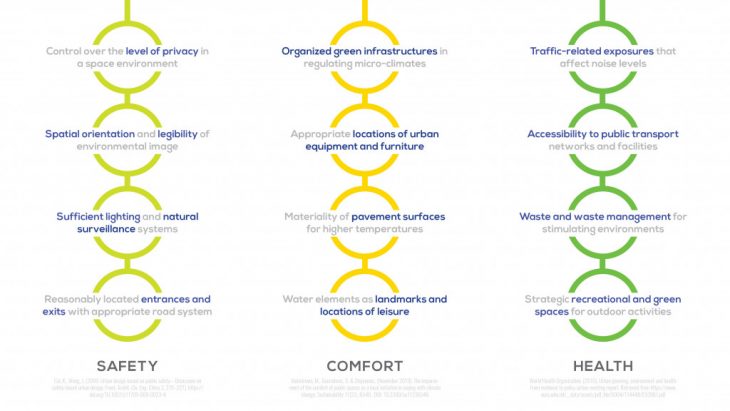
Research was conducted to identify what urban elements influence the user perception of urban environments with regards to Safety, Comfort and Health.
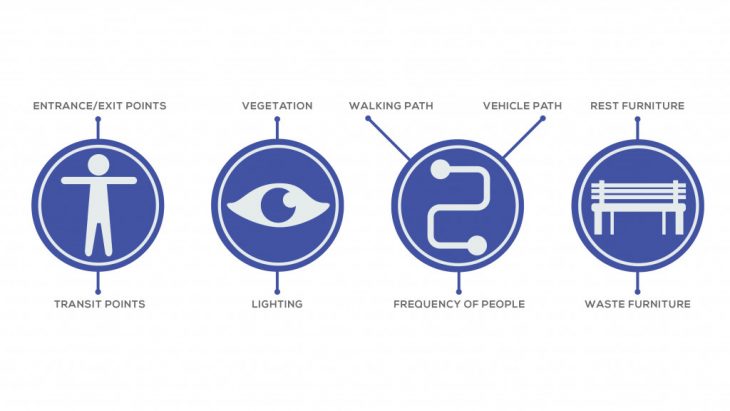
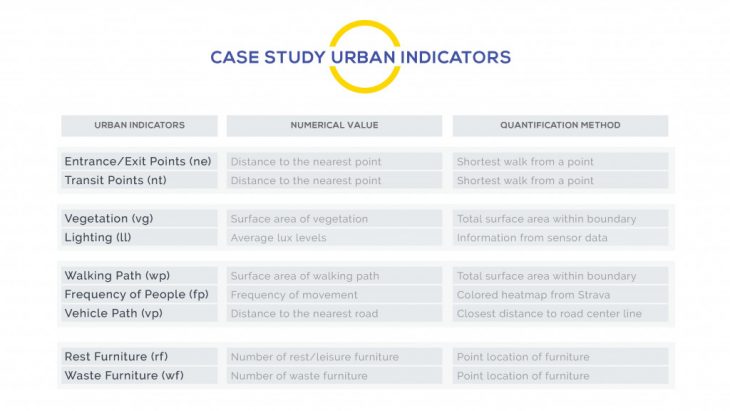
This data can be summarized into four main categories of urban indicators which are accessibility, visibility, circulation and infrastructure – expanded into 9 core indicators that influence these groups that DUNES focuses on.
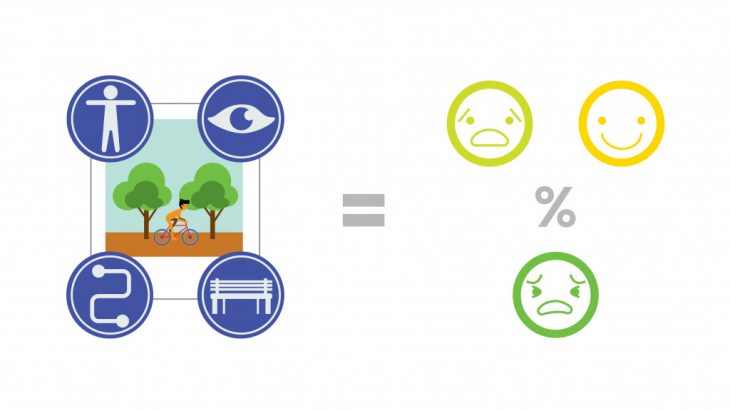
In order to understand the inter dependencies of these urban indicators with regards to the emotions, the DUNES interactive survey facilitates this process by embedding visual information with urban indicator values. Through the user responses, we can evaluate numerical data that would result in the gradients of Safety, Comfort and Health.
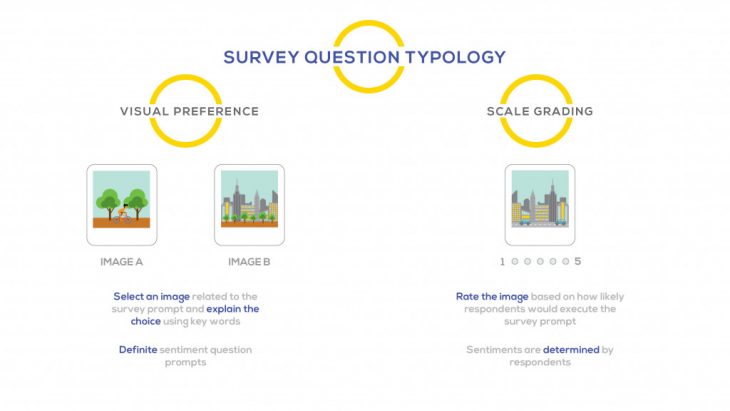
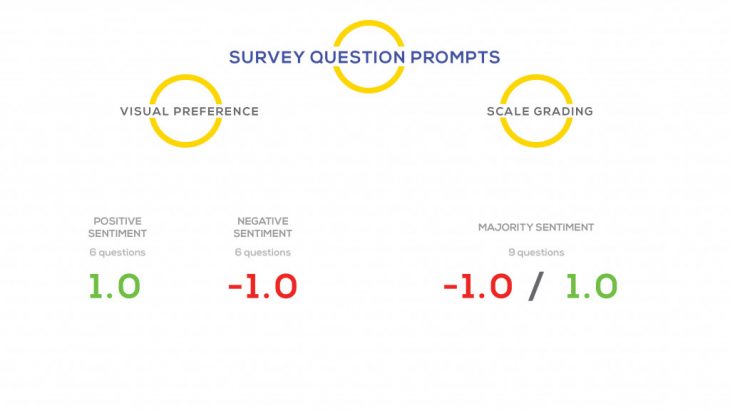
The survey consists of 21 questions with two specific question typologies which extract sentiment as well as key words to evaluate these emotions based on the urban indicators. With the visual preference typology, there are definite values of sentiments which form the basis of the analysis and the scale grading provides for a more dynamic response depending on the majority.
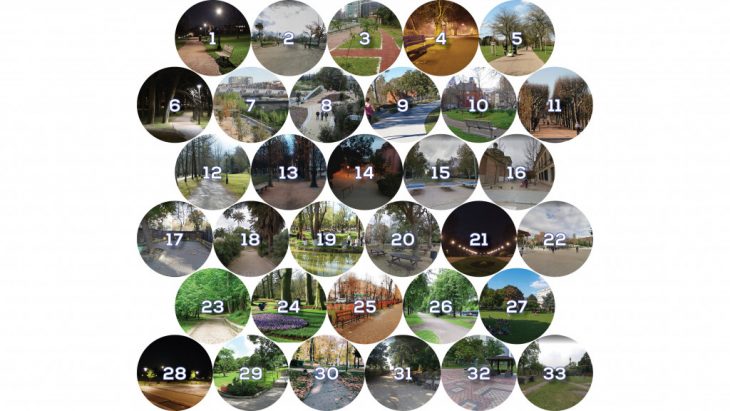
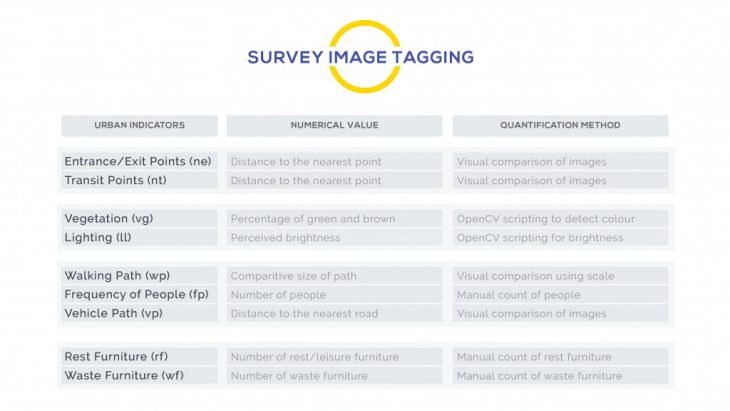
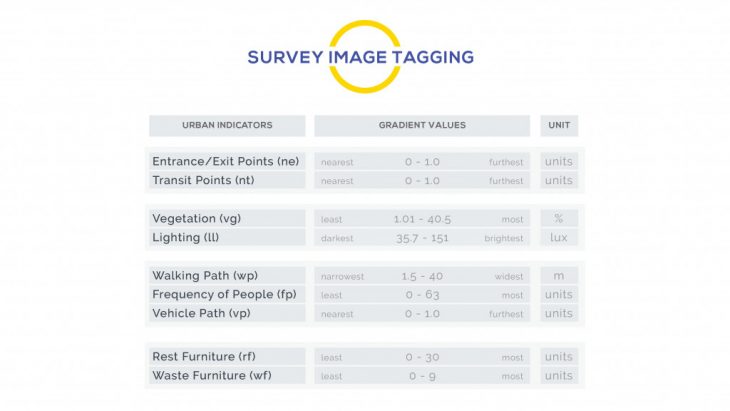
33 images of various urban park settings and environments were extracted due to their typological similarities with the case study. By implementing visual comparisons and counting as well as OpenCV scripting, the urban indicators are quantified for each of these images and the range of values are mapped. Then, the images for each survey question, with regards to their prompts and themes, are chosen based on visual relevance as well as urban indicator values to derive conclusions that are diverse and gradiational.
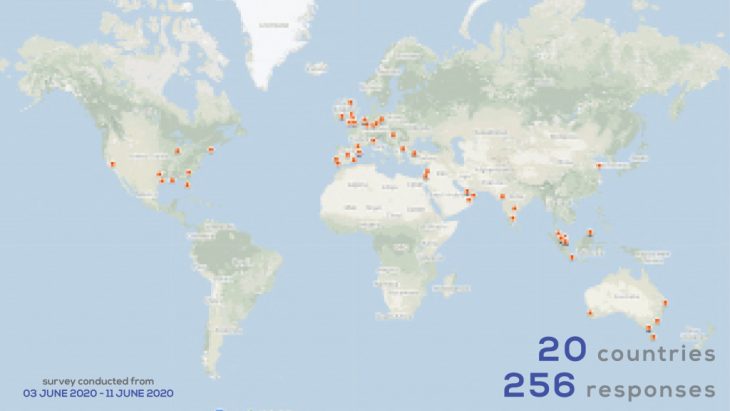
For ease of access and spread, Google Forms was used to conduct the survey and a total of 256 responses were recorded from the 3 of June 2020 to 11 June 2020 from 20 different countries.
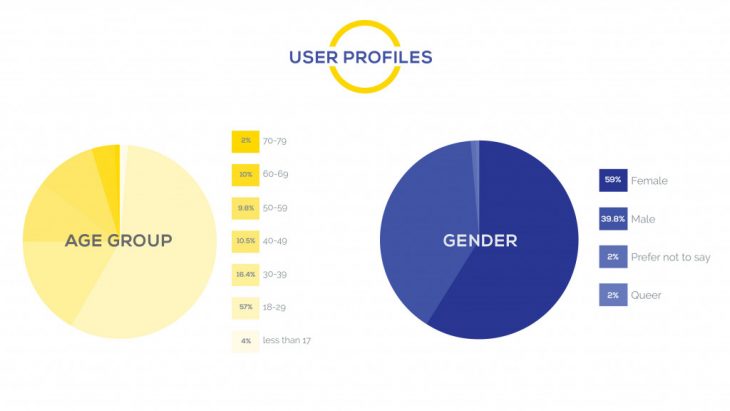
Although the user profiles can be expanded, DUNES focused on age and gender for the development of this methodology.
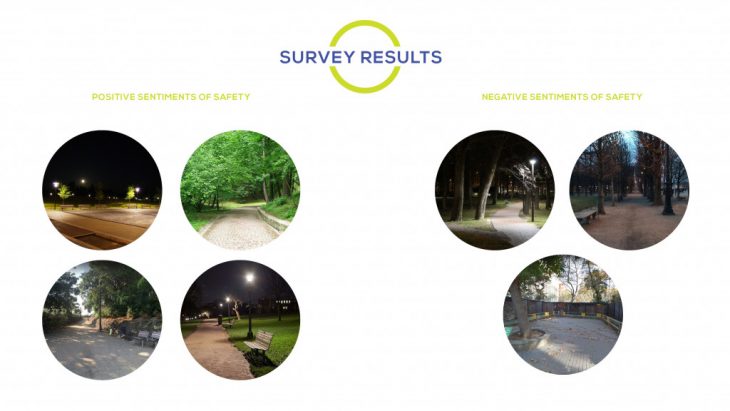

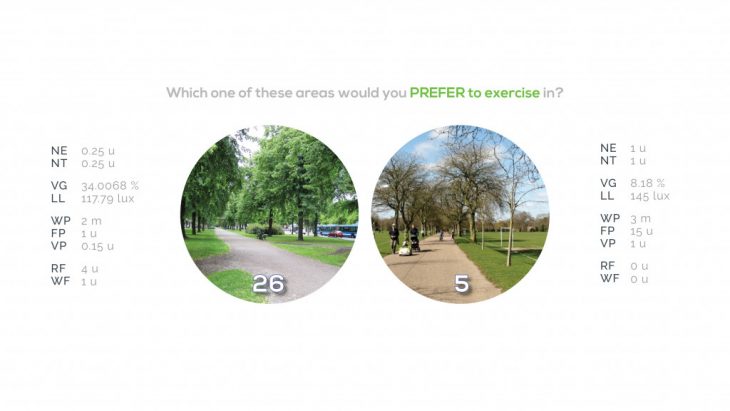
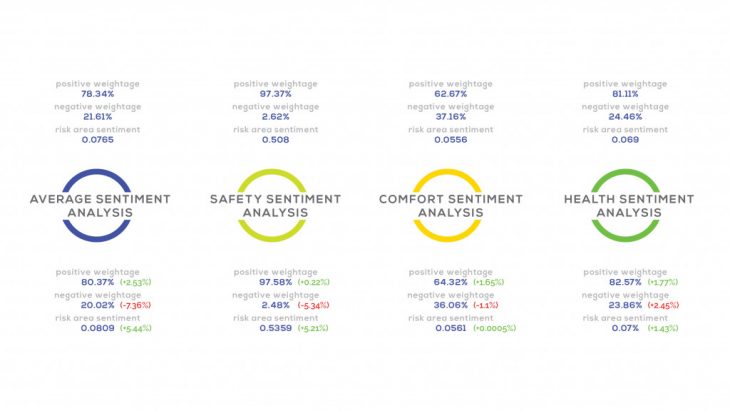
As a result, the Sentiments for Safety were mostly influenced by lighting conditions along with frequency of movement of people as well as presence of vegetation.
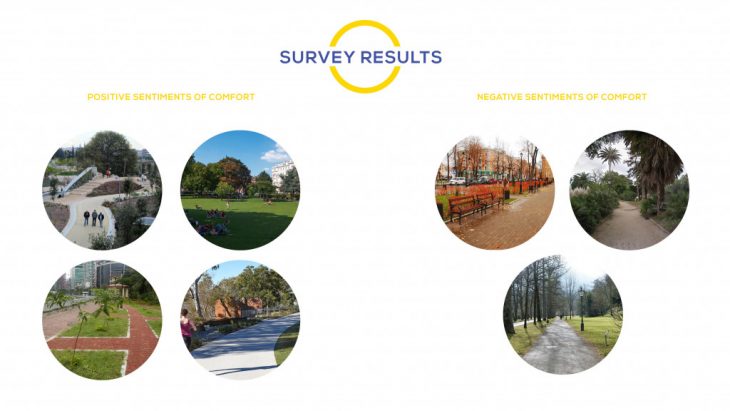
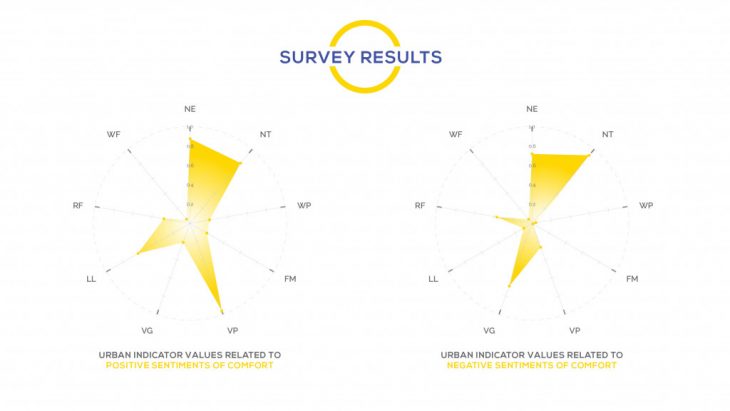
For the sentiments of comfort, the presence of urban furniture and proximity to roads were influential in affecting the user perception along with the proximity to the nearest exit and transit points.
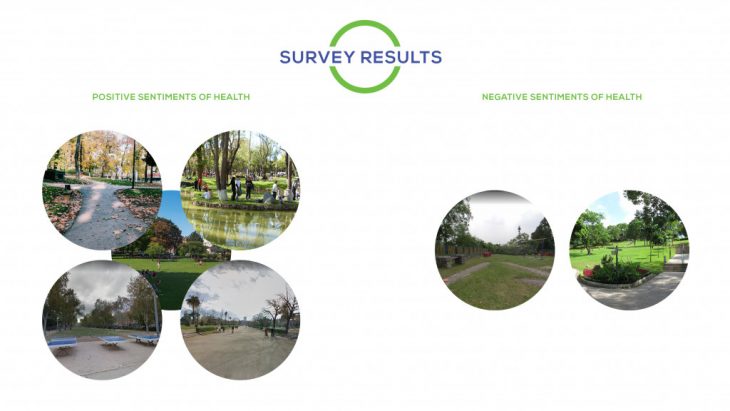
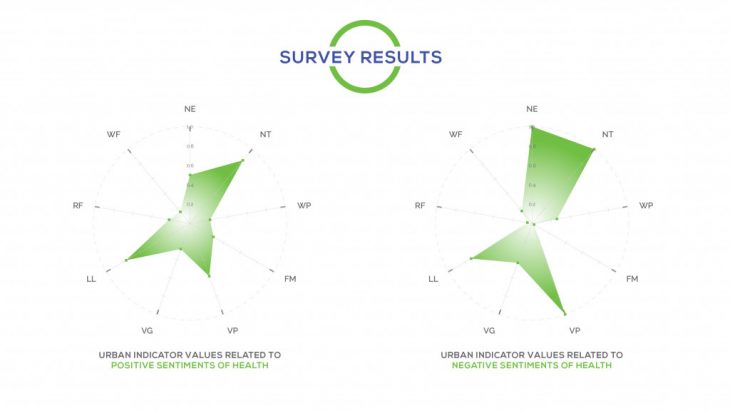
With regards to sentiments of health, light levels as well as frequency of movement were most influential along with the proximity to the nearest exit.
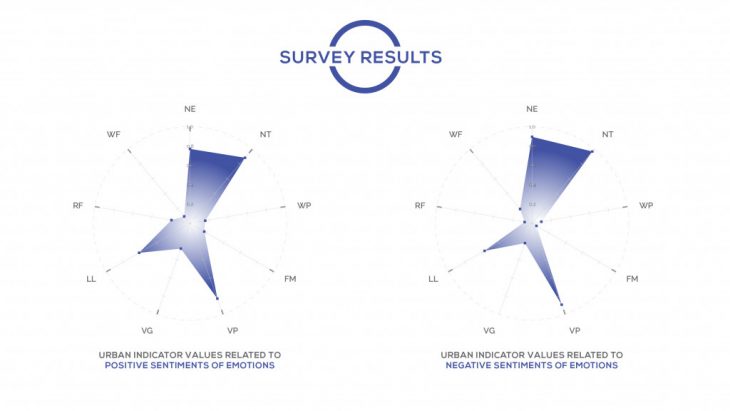
With the overall sentiments, infrastructure and circulation were key components in influencing the user perception of space.
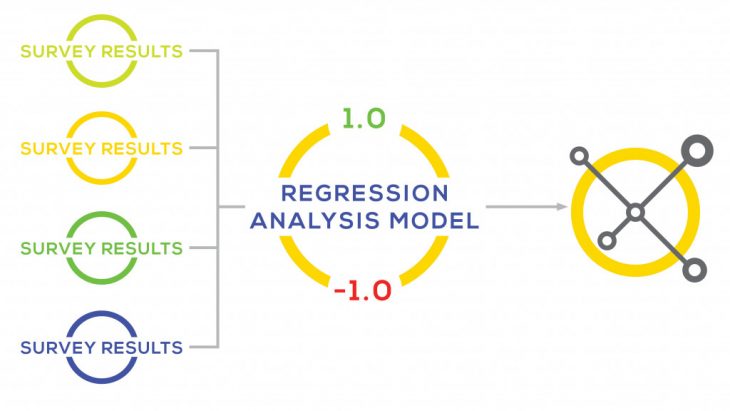
Using the values derived from the survey results, a regression analysis model is trained to identify values or urban indicators that influence the sentiments. This model is used later on in the Data Simulation phase.
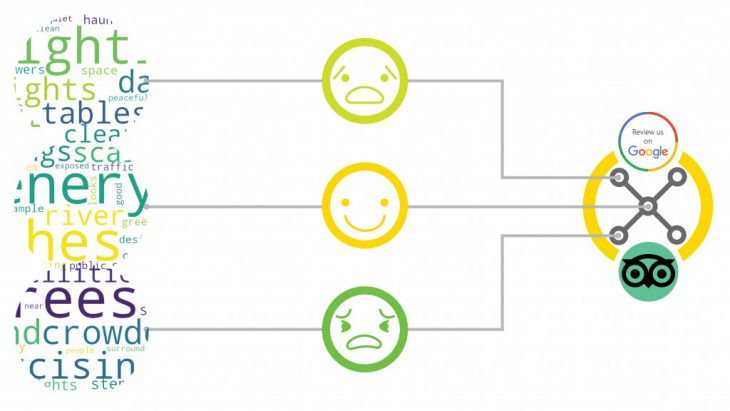
Using the text data from the survey, an emotion classification model can be developed in order to analyse existing reviews based on the three emotions.
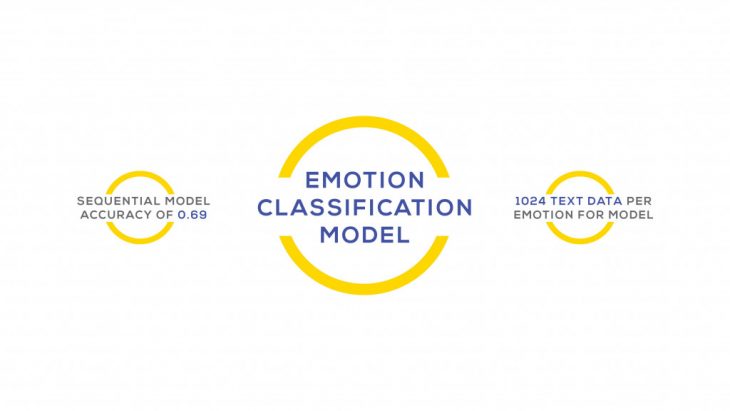
With the model set up, there was an accuracy of 0.69 due to the size of the data set acquired from the survey. As the size of the data set increases, the training model would be more accurate.
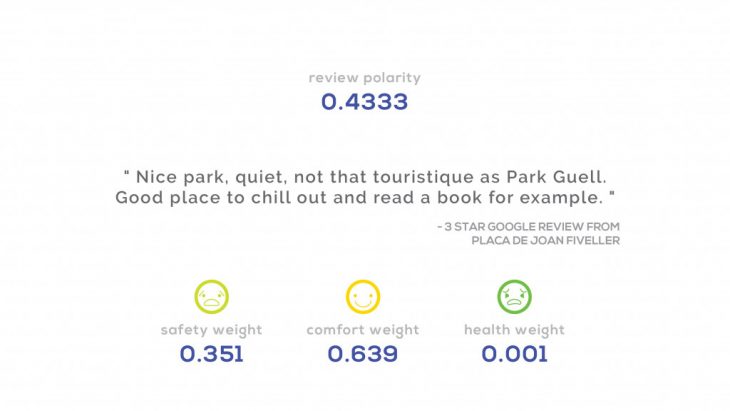
Through the classification model, we are able to acquire weightage of the emotions based on text data.
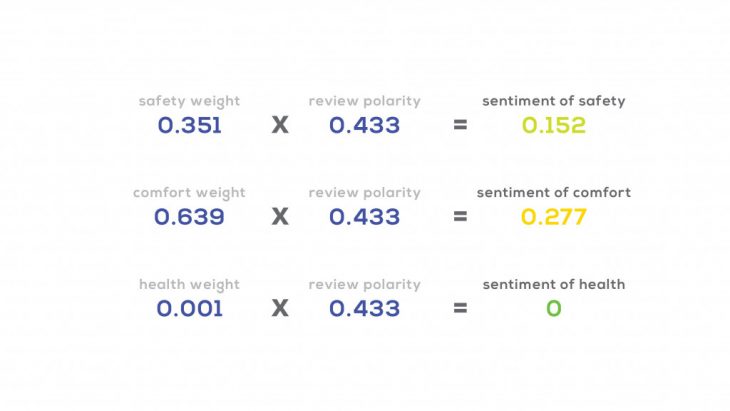
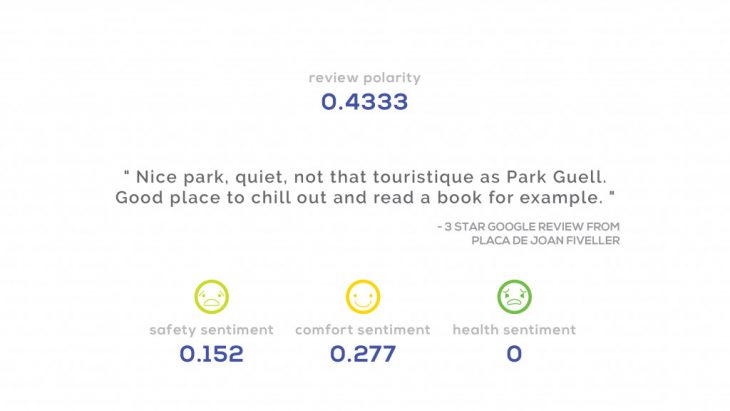
Through simple mathematical caluclations, we correlate the weightage of the emotions with the polarity of the text in order to derive the emotion sentiments through numerical data creating a higher resolution of analysis from just one piece of text data. When applied to the the database created, average values of these three emotions can be generated on a heatmap.
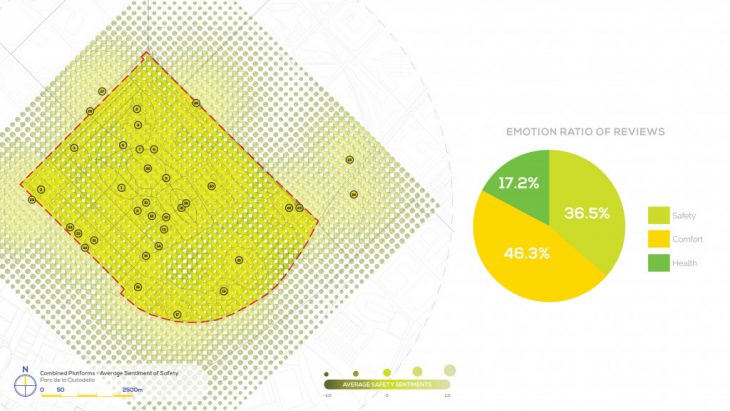
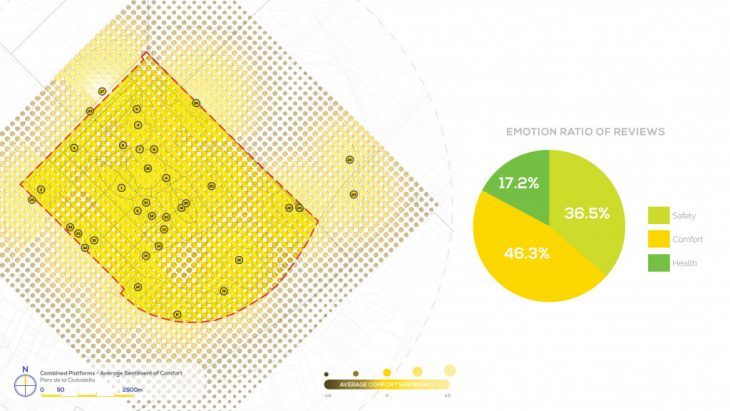
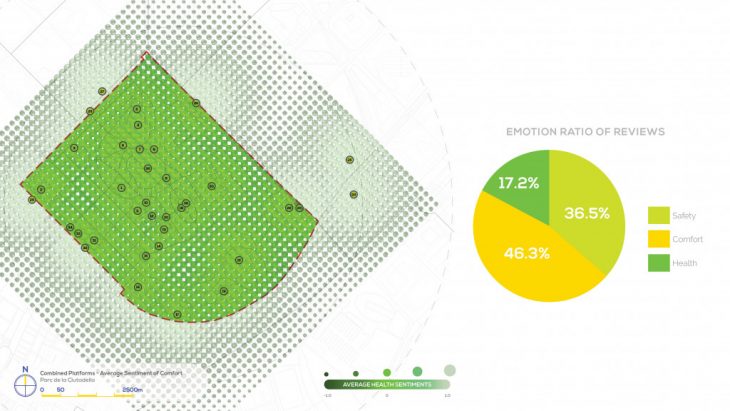
When generating the heatmaps for Parc de la Ciutadella, it can be seen that Comfort was the most frequent emotion followed by safety and health.
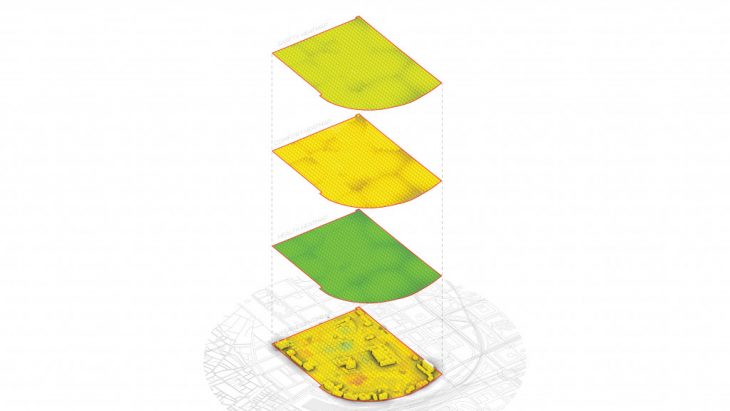
When all these heatmaps are overlapped with the original polarity heatmap, potential risk areas or areas of interest are able to be determined.
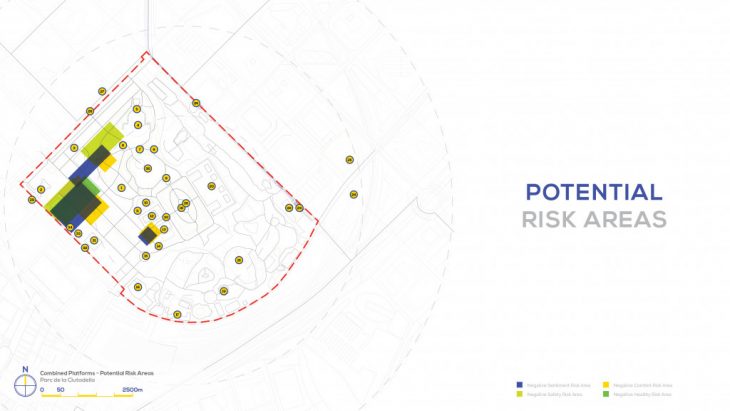
To further the analysis and conduct the simulation, these areas of interest could be aggregates or isolated based on emotions.

To develop the methodology, this specific area of interest was identified because of the overlap of all the emotions.
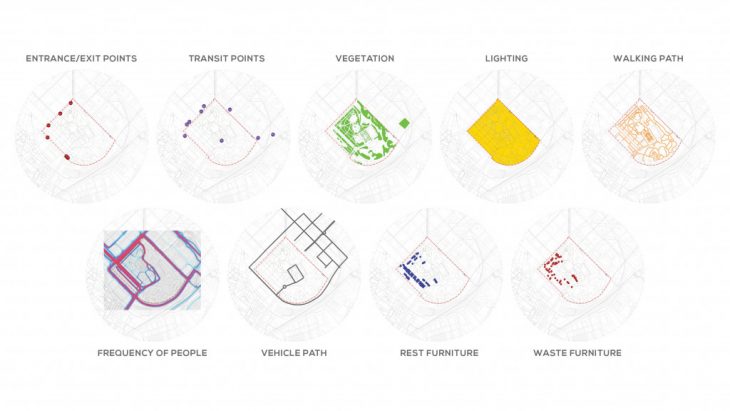
The urban indicators determined earlier needed to be extracted from the case study as well. Using various computational strategies, existing databases, satellite imagery and sensor data, the various urban indicators were extracted from Parc de la Ciutadella.
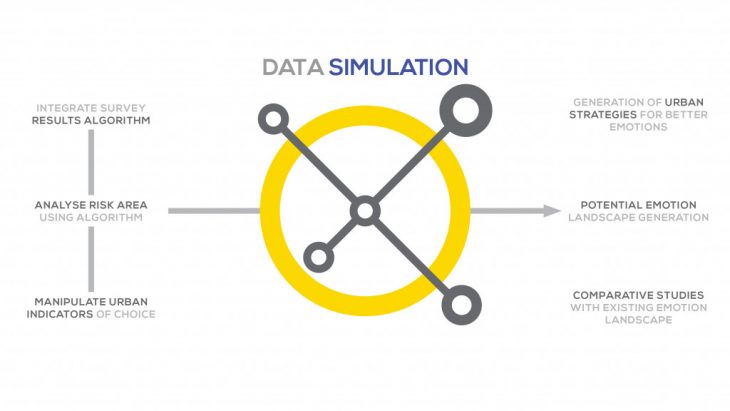
With all the relevant quantitative data set up, the prediction and simulation of emotion environments in the case study can be executed using the machine learning models that were set up in the Data Evaluation phase.
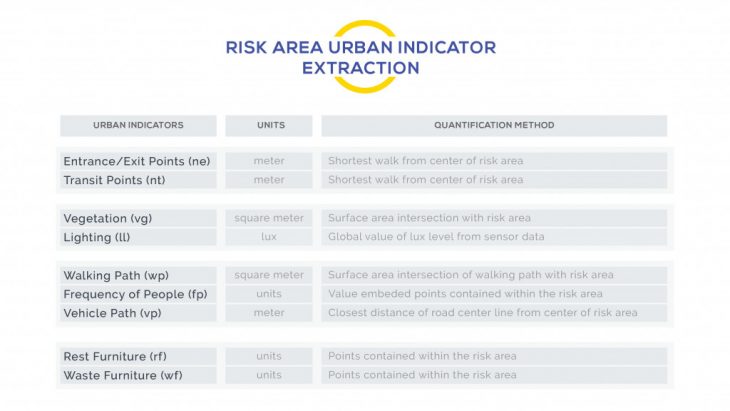
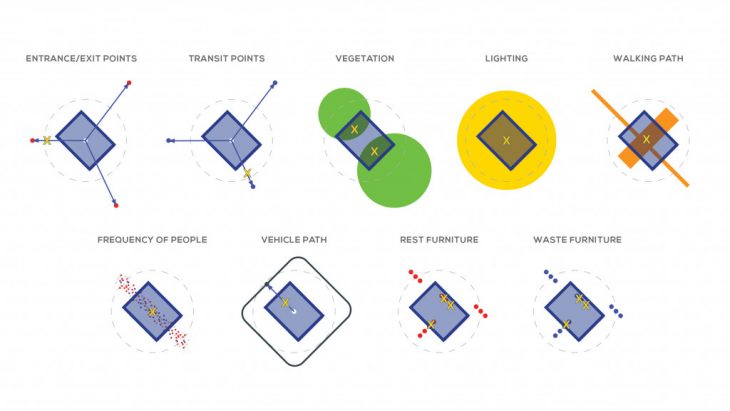
The urban indicator extraction is also applied to the risk area determined by using the center and the area as a basis of normalization of data.
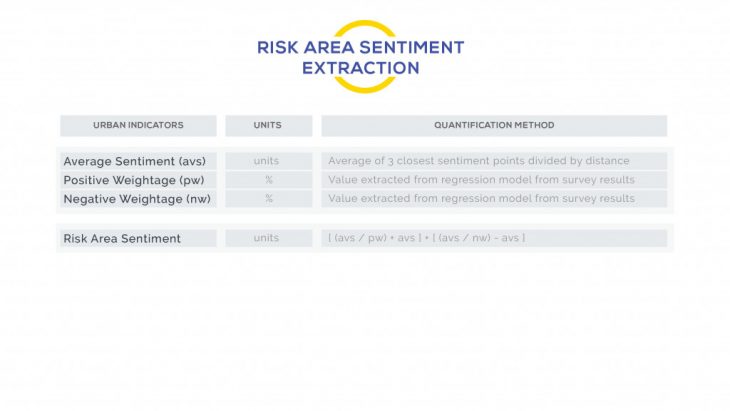
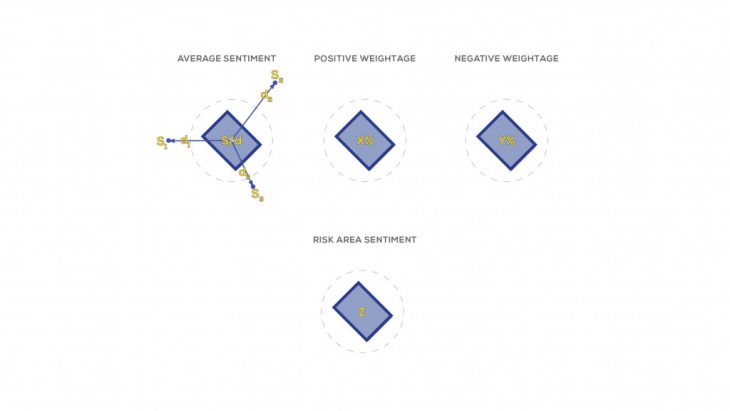
With regards to the sentiments, calculations using weightage and distance from nearby sentiment points are able to determine the sentiment of the specific risk area.
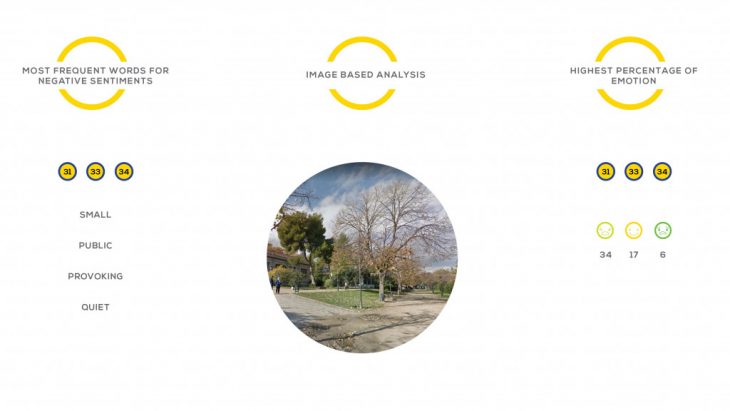
Moving forwards with the analysis, three forms of data could be looked at to inform the design decisions which are the topic modelling key words identified from the 3 closest points of review, image based analysis of the area or the most frequent emotion that is rated the lowest.
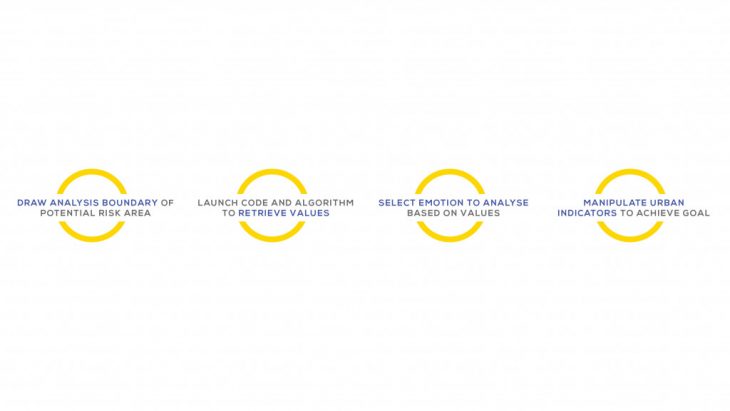
The digital environment set-up is straightforward. The urban indicator layers to be manipulated are activated followed by determining the area of the analysis boundary. Once the code is launched, the values of the emotions and urban indicators are retrieved and can be manipulated to achieve the desired emotion percentage outcome. For a video on the simulation, click this [ link ]. From the analysis it can be seen that the sentiment of comfort is the lowest and should be increased.
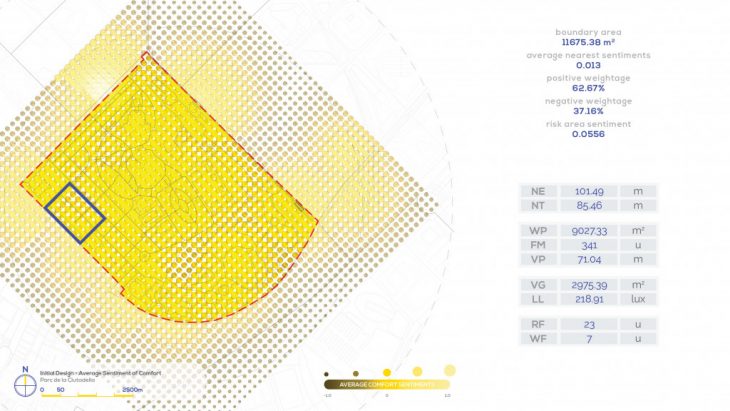
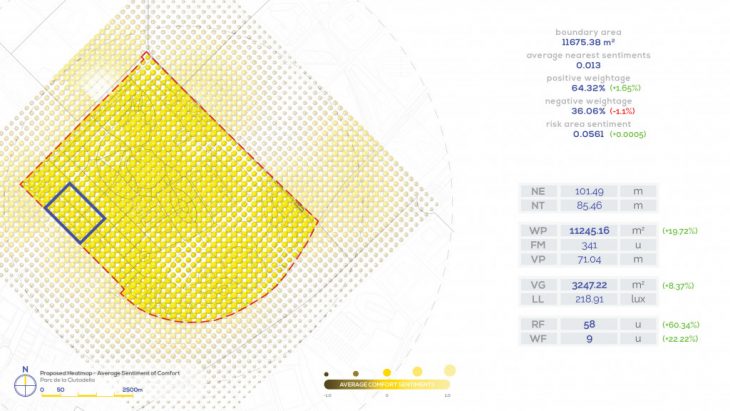
In comparison with the original comfort heatmap, there are changes that can be seen in terms of the sentiment values when the urban indicators are manipulated.
This manipulation of one emotion also affect the rest so decision-makers could use this information to balance out the emotions on their projects or focus on developing one emotion. Although the value increase is small, the methodology to achieve a quantifiable method of evaluating emotions is substantiated.
CONCLUSION

In conclusion, DUNES proposes a tool to aid decision makers in designing livable cities by engaging the citizens in measuring the quality of the urban environment using quantified emotions to make better informed design decisions.
The methodology of DUNES can be replicated to different urban environments such as touristic locations, simply by adapting the emotions, urban indicators and survey prompts to suit the analysis.
Potentially, DUNES could be used in a more macro scale through the use of generated geo-localized points within the boundaries of a building and adding urban indicator parameters such as materiality and aesthetics.
To watch the full final presentation, click on this [ link ].
To watch the presentation of DUNES for the Centre of Urban Science and Progress, King’s College London, click on this [ link ].
DUNES ( Dynamic Urban Nodes Emotion Simulator ) is a project of IAAC, Institute for Advanced Architecture of Catalonia developed in the Master of Advanced Architecture 2019/20 by:
Student: Surayyn Uthaya Selvan
Faculty: Areti Markopoulou, Nikol Kirova and Eduardo Chamorro Martin