Brief
The word collation is the collection and ordering of materials. This project defines a new workflow to sort and locate the material from the pre-demolition site to create a more reliable report of the resources available in old buildings. The purpose is to reduce the demolition waste generated by using the obsolete constructions as a mine for future buildings.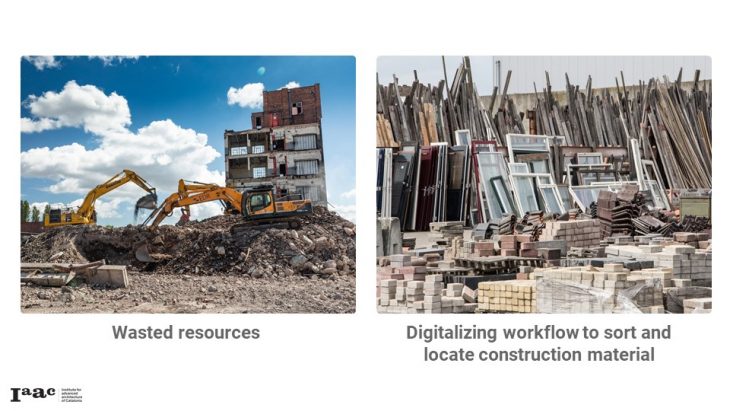
Introduction
The production of materials needed to satisfy the demand for new architectures generates a great impact on our environment. Meanwhile, every year resources are lost during building demolitions and almost thirty percent of the waste generated in the European Union comes from the construction industry. In the following graphic, we can see the current flow of the most used materials in the construction (concrete, masonry, wood, and metal) and what would be a more ideal situation of their life cycle.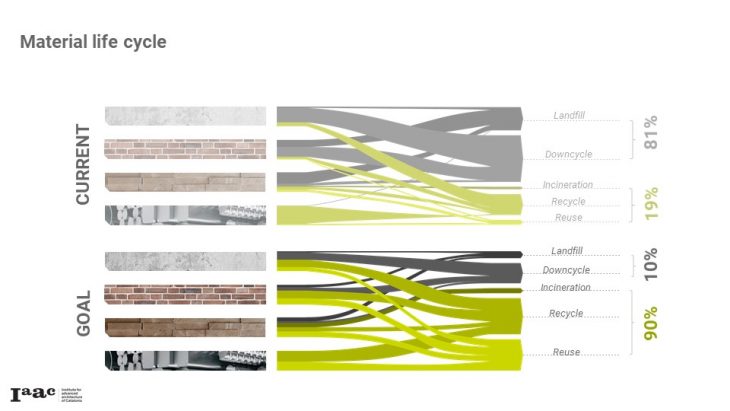
?The term urban mining is born from the perspective of environmental concerns and aims for more efficient use of the construction materials available in the shape of building stock. The purpose is to reduce the use of virgin sources, generating savings through improving secondary resource use and lowering the negative environmental impacts. The sifting of buildings to obtain material is something that has recurrently happened in history but the tools used to perform these tasks haven’t evolved. For example, Romans used the Forum and the Colosseum as quarries of marble that their ancestors gathered from all the Mediterranean to build the Cosmantesco floors.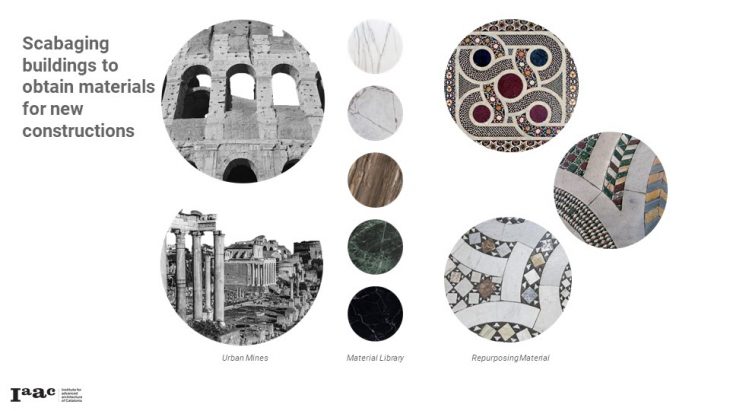
Project
In order to use the resources available in the buildings, the first step is to identify them. Therefore, the aim of this research is to characterize and classify the demolition waste from pre-demolition sites. In the following diagram, we can see companies that are already involved in the deconstruction sector. Our added value to what they are offering now is that we are embedding technology in this process in order to have a more accurate and reliable material report. The potential costumers of this service could be the building owners, the architects or the construction and demolition, contractors.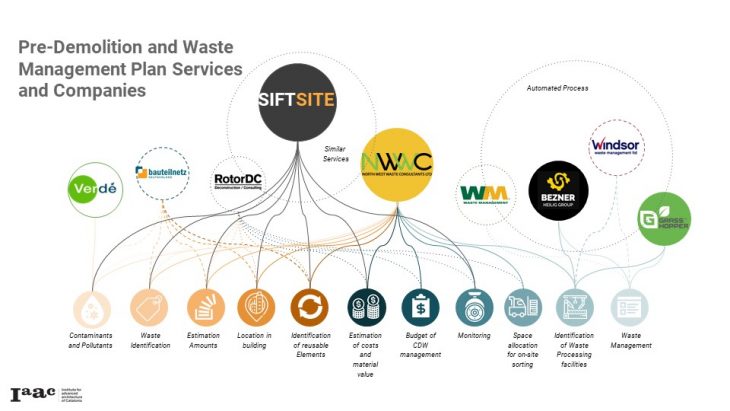
The way we are displaying the data of the report is through a user interface. We want to have a material research tool that shows the amount of material, its value, where it is located, and images related to the specific material. We also want it to be relevant in providing information about the coordination of the deconstruction actions.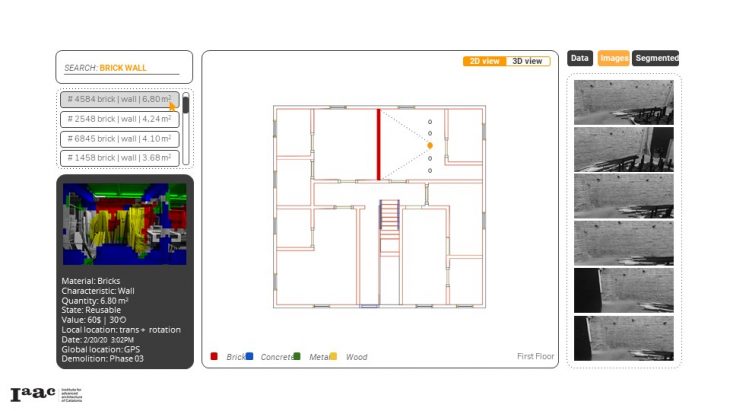
Development
Firstly, we inspect the demolition site; Secondly, we used the gathered data to do a geometric reconstruction; Thirdly, we perform classification and location of the materials; And finally, we process the information and present it in a user interface.
Step 1. Building Inspection
We bring drones that capture images of the field in order to digitize it. We use drones instead of ground robots because they can work in rough terrains, they can reach higher heights and they allow us to also do exterior inspections. More information on the drone flight : digitizing the predemolition site.
Step 2. Geometric Reconstruction
From the exploration flight, we have two desired outputs, the first one being an octomap from OrbSlam2 for a further autonomous flight and the second one a colored dense point cloud from photogrammetry. The point cloud will be used to produce a 3D environment where all data acquired will be shown.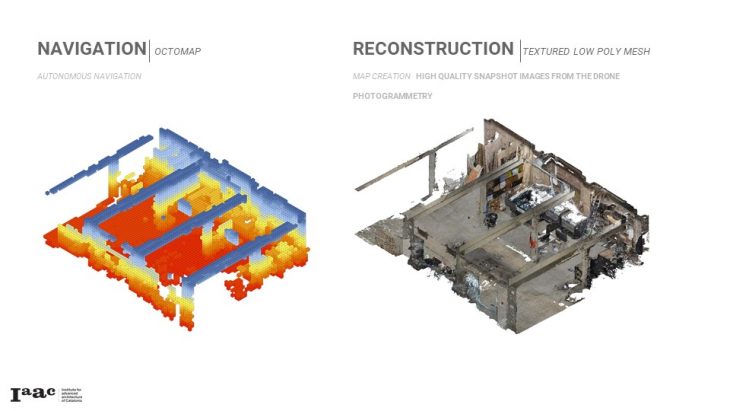
The environment is processed in Cloud Compare to extract the architectural and structural elements from the point cloud. After having all the elements as geometry files, the surfaces or meshes are imported into Grasshopper for further cleaning. The output of the whole process is a quad mesh element named as ceiling, beams, columns, floor, and wall.
Step 3. Classification and Location
From the imagery of the first step, we start annotating localizations of our relevant materials. A classification algorithm is applied to a grid of smaller patches of the image and colorized accordingly. In order to localize the materials, we need to train the algorithm, perform a material classification and finally, the material localization.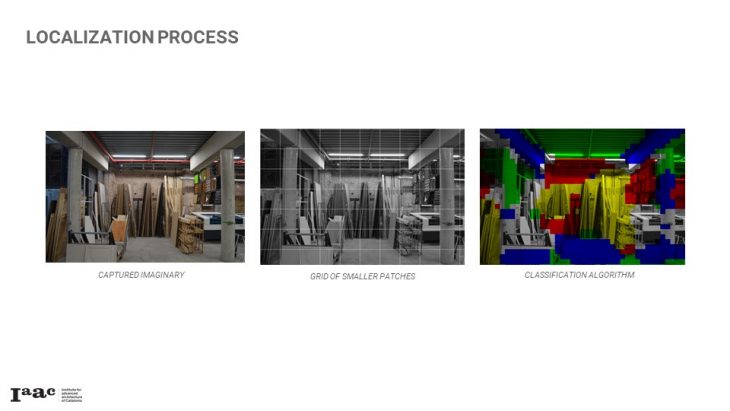 The image classifier is trained with one set of images for each category, both close up to describe the texture of the material, and as part of various building elements to describe its shape. A none category that contains imagery of other people and objects that will commonly be found in a demolition site has also been included in order to avoid false positives.
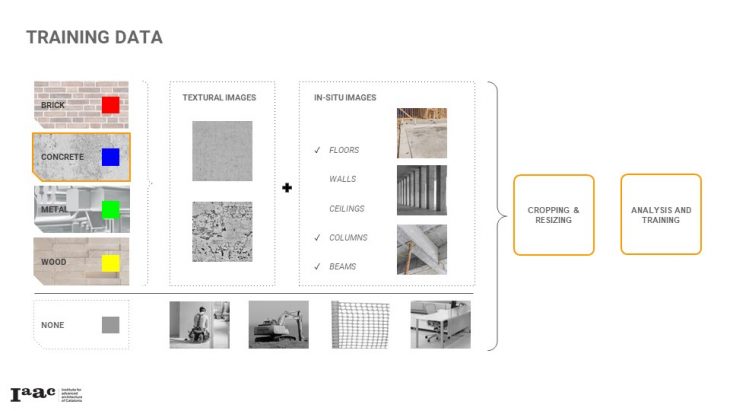
The actual classification starts with a mathematical description of the regions around certain points of interest, or features. In this case, the algorithm finds these features at the ‘corners’ between edges in image brightness. The descriptor algorithm (BRISK) then performs a series of simple binary comparisons of brightness in a pattern around the feature and combines these together in a binary string. Finally, these descriptions are clustered together to obtain a limited set of ‘code-words’ that can describe our images, and a model is trained to associate specific histogram-concentrations of these codewords with each of our categories. 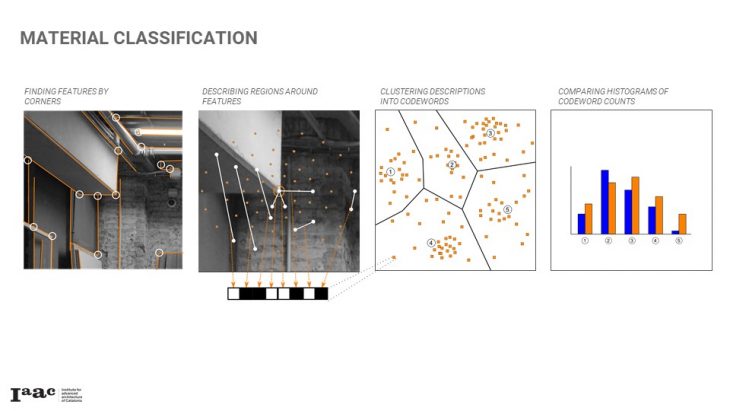
The classifier we are implementing works best on image patches at least 100 pixels on aside. To obtain higher resolution results, we move this hundred-pixel window in smaller increments for a series of overlapping classifications and then average out the predictions for each smaller subpatch. These predictions are weighted with some simple heuristics looking at the average trends of hue and saturation in each category. 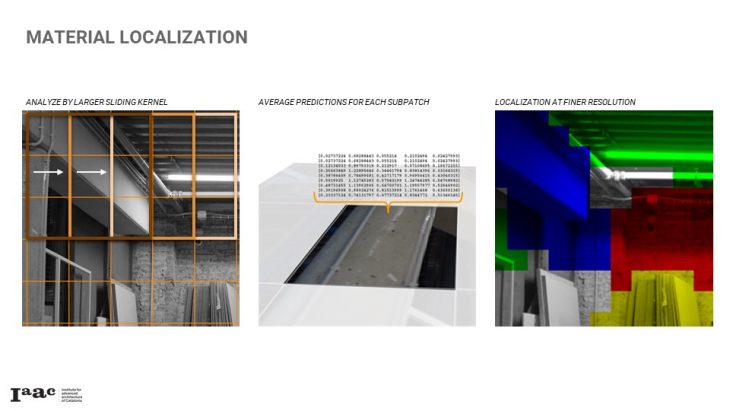
The following image shows the final outcome of applying the algorithm in the imagery collected by the drone. You can find a more extended explanation on the material detection and localization in this repository: Material Localization 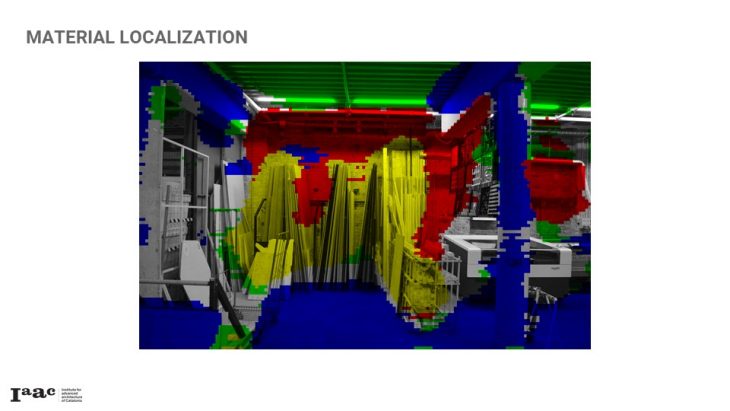
Step 4. Planning Interface
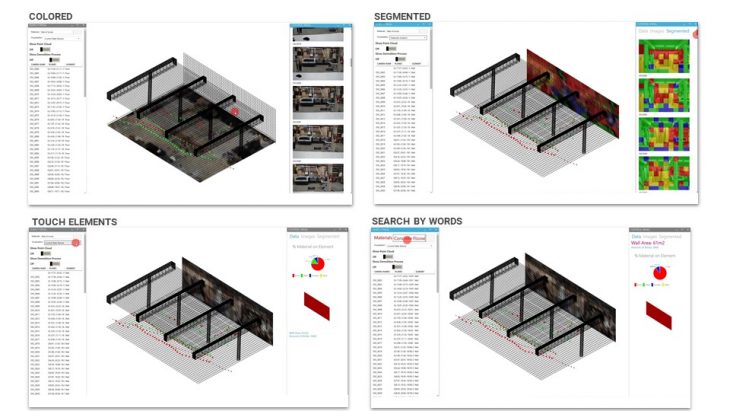
The last step is to gather all the information generated in the previous steps and assemble it to display it in the user interface. Using cloud compare and the images with the material location we build the point cloud and the colored mesh.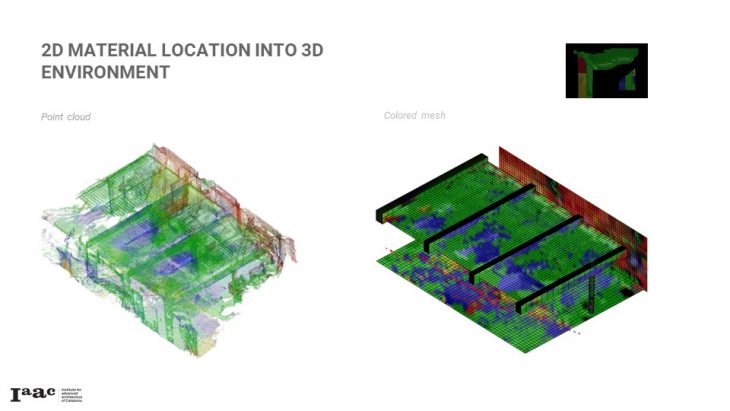
Once this colored mesh is built, a piece of important information that we can obtain from it, it is the waypoints to perform a second flight. In case there is confusing information and we need to get more data to build a reliable report, we can send the drone to capture more information performing and autonomous flight. The second flight will be using the information collected from the first one (octomap + waypoints).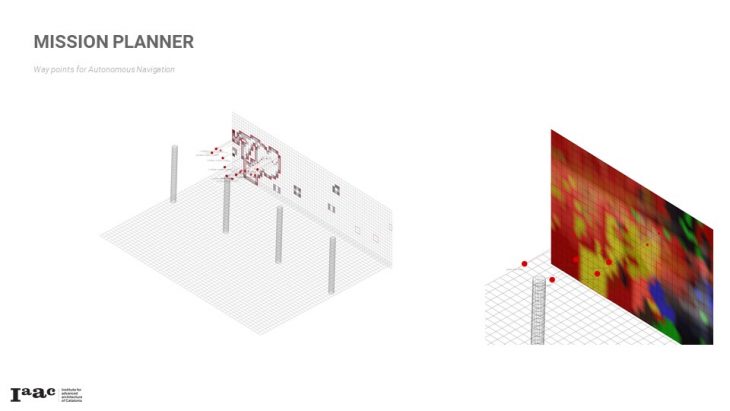
The different features are implemented in the user interface. Image retrieval from the 3D environment allows each time to select an element such as “floor” to get all the images related in position and rotation to that geometry. The same procedure can be done with the segmented images. It can also display information on the type of material, its corresponding area, and the quantity approximation by touching the element or searching by words.
Final Output
The current interface focuses on clearly presenting the documentation, spatial features, and material analysis of a demolition site. Further functionality from here would include deeper practical integration with planning the demolition phase over time, both from a physical standpoint with the logical and structural order in which elements will be removed, and a data standpoint to integrate with BIM and project planning software.
Additionally, the points of interest, alongside the spatial octomapping, will inform the control of additional automated flights to check areas of more complicated or questionable detail.
Please do not hesitate to also visit our website: SiftSite
Digitalizing Material Collation from Pre-demolition Sites is a project of IaaC, Institute for Advanced Architecture of Catalonia developed at Masters of Robotics and Advanced Construction in 2019-2020 by Students: Anna Batallé, Irem Yagmur Cebeci, Matthew Gordon, Roberto Vargas, Faculty: Aldo Sollazo, Daniel Serrano