In the design practice, often the most impactful solutions regarding the building geometry are decided in the first phase of the design process. This is done by the architecture team alone, without strong involvement from structural engineers. At the time when structural consultants get involved, there might not be room for any feedback on the form. For structural performance however, overall form matters much more than member sizing or material. Taking structural performance into account early on results in material savings as well as better endurance and safety of a structure. (1)
The research question for this master thesis is how can we improve the collaboration between architects and engineers and provide interactive, performance based design tools for early design?
To allow the influence of structural performance on the overall geometry of a building, it is crucial to explore diverse designs according to architectural and structural performance in the early stage of the design process. While existing optimization techniques allow the search for best performing samples, they might not be able to fully account for multiple criteria that govern the design and might not provide a truly diverse design space. Recently, machine learning techniques have been used in the industry for an integrated exploration of numerous design options. The project will focus on the application of machine learning to create a diverse design catalogue accounting for structural performance.
Important topic that influences collaboration between teams is sharing the data and results of the work in a way that is clear and accessible to everyone involved. Visualization tools help to understand complex subjects and make the data accessible to the wider audience. In the project, a method of sharing the data with the use of a web application is explored. This allows for interactive exploration of the design problem, without the need to install any software.
STATE OF THE ART
DESIGN SUBSPACE LEARNING
In the paper Design subspace learning (2), the authors, Renaud Danhaive and Caitlin Mueller address the main 2 shortcomings of existing techniques of design space exploration. First being that effectively searching a large design space manually is infeasible, and design optimization overlooks qualitative aspects important in architectural and structural design. The second is that design optimization overlooks qualitative aspects important in architectural and structural design.
The research focuses on integrating generative machine learning techniques such as conditional variational autoencoders in a performance-driven design exploration framework. Authors propose a prototype interface for latent space exploration, where latent space created by encoder is visualized as a map that takes into account performance parameters for each sample.
The methodology stars off with performance driven sampling. A sampling algorithm generates a dataset of meaningful design options from an unwieldy design space. Next, a performance-conditioned variational autoencoder with a low-dimensional latent space is trained using the collected data. This results in 2 dimensional latent space is intuitive to explore by designers even as it offers a diversity of high-performing design options. Decoding samples from the latent space, geometries are generated based on recreated design parameters. Authors propose a prototype interface of a design subspace exploration tool.
OBJECTIVES
MACHINE LEARNING ACCESSIBLE TO DESIGNERS
Applications of Machine Learning techniques such as Self Organizing Maps (3) (4) and k-means clustering (5) have recently been explored in the context of design space exploration for architecture and engineering. State of the art paper (2) shows an important step towards implementation of deep learning into design practice, enabling performance conditioning and variety of the design catalogue.
As those applications are not commonly used by architects and engineers yet, the goal of the project is to make these techniques accessible and create an open-source workflow that enables interactive design space exploration. The step by step instructions together with case study files are shared in a GitHub Repository.
INTERACTIVE VISUALIZATION TO HELP COLLABORATION
Visualization is the helping factor in quickly understanding the data, helping decision making and understanding the next steps. Moreover, it helps make data accessible to a wider audience and involve more people in the decision making process.
The results of the workflow are implemented as a web app, that can be used to interact with the samples in the design space. The presented case study is an example of integrating structural performance in the early stage of the design stage, with collaboration of architects and engineers.Similar performance based exploration might be used to facilitate collaboration between different stakeholders in the design process, taking into account various constraints as the performance condition.
METHODOLOGY
WORKFLOW
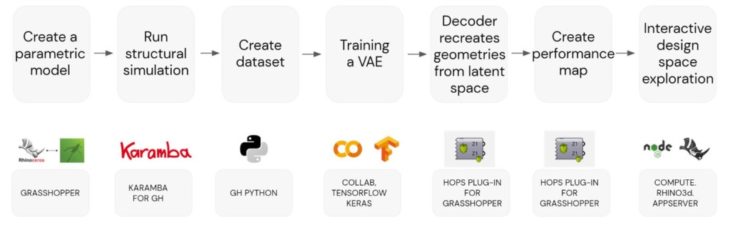
The workflow starts with creating a parametric model for a desired geometry. The model is then analyzed for a specific performance, ex. structural or environmental performance. Dataset of samples is created by randomly generating parameters and running analysis for each geometry created by those parameters. In the next step, Variational Autoencoder model is trained with the dataset. Decoder recreates geometries from the latent space. Finally, performance map is created that enables exploring samples generated from the latent space. By linking the results with a web interface, the outcome is a platform for interactive design space exploration. The next chapter describes a case study created to present the application of the workflow. The main software environment used is Rhinoceros and Grasshopper, utilizing Karamba plug-in for structural analysis and Grasshopper Python script to automate dataset creation. Machine Learning training was performed in Google Collabolatory Notebook using Tensorflow and Keras libraries. Hops plug-in for Grasshopper was used as a link between Machine learning libraries and grasshopper geometry. Node.js and rhino3d compute appserver enabled hosting the grasshopper script in the web application.
CASE STUDY
PARAMETRIC MODEL AND DATASET GENERATION
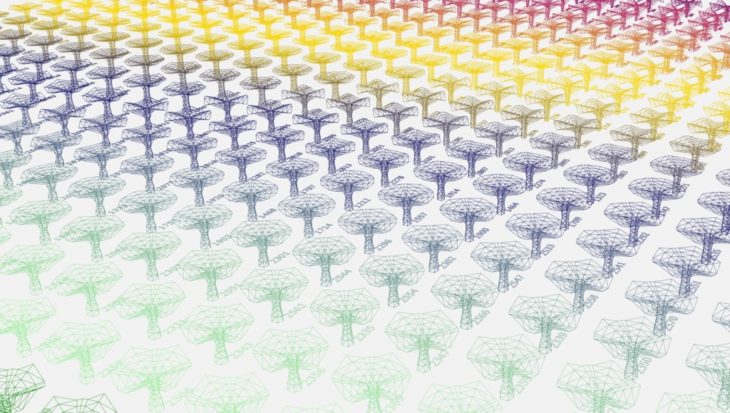
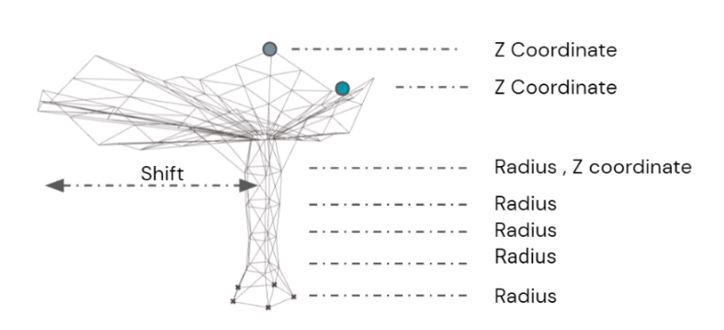
As a case study, a canopy truss structure composed of a column and a roof was investigated. The column was created with variable radius at a certain elevation, the roof with variable control points and lateral shift. Figure 3 shows the parameters governing the geometry of the canopy.
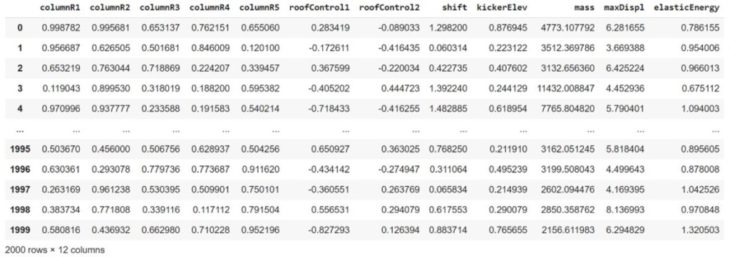
A dataset was created by randomly generating parameters that describe the geometry and running structural simulation for each sample. The calculations were performed with Karamba plug-in for Rhino and Grasshopper. Each sample had the same number of elements. For each sample, the cross section optimizer found the most optimal cross section for each member within the family of HSS structural steel elements. Structure was subjected to live load of 2kN/m2 acting on the roof as well as self-weight of the elements. Selected results, such as overall mass of the structure, maximum displacement and elastic energy were saved in the database, together with parameters describing the geometry of the sample.
MACHINE LEARNING
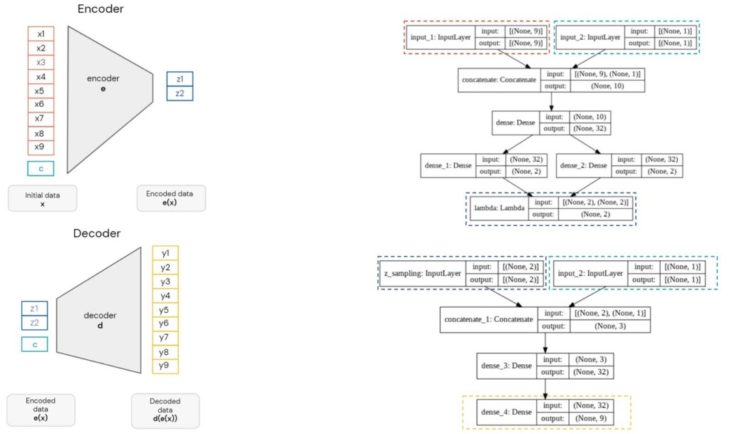
Autoencoders are a type of generative models that are trained to reconstruct the input from an intermediate representation. Autoencoder architecture comprises of an encoder and a decoder, shown on the below. The encoder tries to learn the representation of the input data. The decoder tries to learn to reconstruct the hidden representation into input space.
Variational Autoencoders (VAEs) produce probability distribution over latent space instead of points like in a typical autoencoder model. The training is regularized to avoid overfitting. In result, the latent space is continuous and complete. Variational autoencoders are a part of the family of variational Bayesian methods (6) (7). The VAE model is trained to minimize the objective function, composed of 2 terms. The first term, called reconstruction loss, encourages the decoder to reconstruct data using samples from the latent space. The second term, called regularization term is expressed as the Kullback-Leibler divergence. This term encourages the distributions created by the encoder to be close to a standard normal distribution. While with using Variational Autoencoders there is no explicit control over the generation process, Conditional Variational Autoencoders allow modeling latent variables and data, both conditioned on a selected variable. (8)
With Conditional VAEs a condition c can be introduced, that will steer the generation into the area of interest. In this case study, the condition would be structural performance, specifically the total weight of the structure. Figure below shows Conditional Variational Autoencoder architecture. The performance condition is introduced as an input to the encoder as well as used to reconstruct the data together with the latent space encodings.

The architecture of encoder and decoder models used in the case study are shown in the following diagrams.
TRAINING
In order to train a VAE, 3 models need to be instantiated. (9)First, an encoder that maps inputs into representations in the latent space. The inputs to the encoder are 9 parameters corresponding to the geometry as well as a performance value that corresponds the total weight of she structure. The 9 parameters were scaled using Standard Scaler from sklearn library. Next, a generator, that takes points on the latent space and outputs corresponding reconstructed samples. 2 dimensional latent space was used for the case study. In the paper Design Subspace Learning (2) authors argue, that despite heavy data compression, two dimensional latent spaces allow easy exploration and give satisfactory global view of the potential designs. The latent inputs were concatenated with a performance condition. Finally, an end-to-end autoencoder is instantiated. It maps the inputs to the reconstructed samples. All the models were created using Tensorflow and Keras libraries.
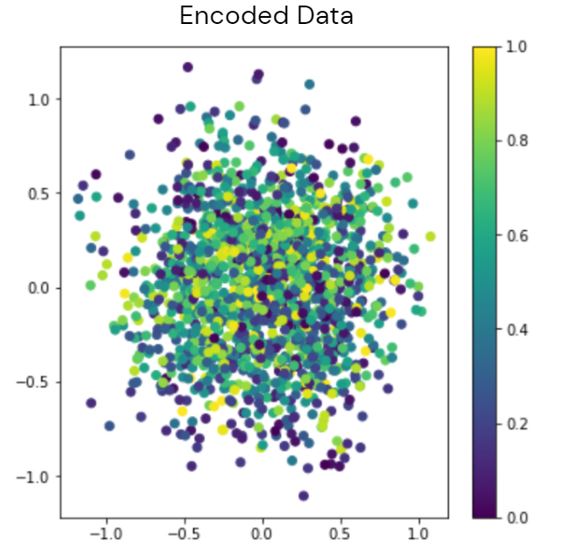
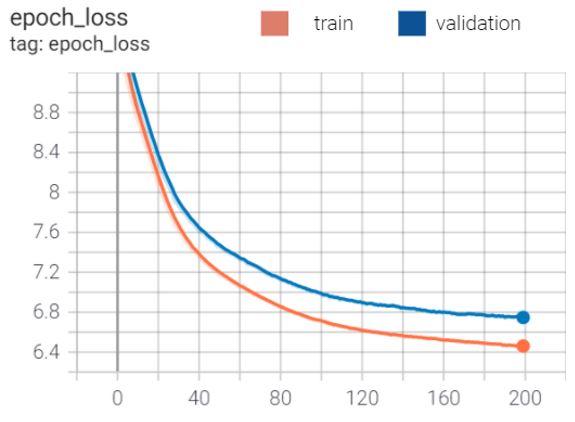
The VAE model is trained using end-to-end model with custom loss function, which is a sum of a reconstruction term and the KL divergence regularization term (9). Adam was used as an optimizer with learning rate of 0.0001. Train and test sets were divided using 80%/20% split. Training was run for 200 epochs, with a batch size of 32. Figure below shows encoding of the samples in the two dimensional latent space. The colors correspond to the performance condition, scaled to 0 to 1 domain. The following diagram shows train and validation losses during the training.
RECONSTRUCTING THE GEOMETRY
A saved encoder and decoder model and together with the scaler used to modify inputs as a file, machine learning models can be linked to the design environment of Grasshopper using Hops component. Hops enables solving files running locally with the use of Flask server. The file running the model can be run inside Grasshopper. Inputs and outputs have to be defined in the file. Then, in Grasshopper environment, sliders can be connected to the component to enable interactive design space exploration. The output of the component are the parameters generated by the decoder. The parameters are then used to recreate geometries using the initial grasshopper definition used to generate the dataset. By moving the sliders and changing Z1 and Z2 and thus “walking” in the latent space, a gradual and intuitive change of the structure was observed. The structures were not present in the training set and were invented by the autoencoder.

PERFORMANCE MAP
Three dimensional performance maps can be obtained, linking encoded points with performance values. For each sample generated with latent variables Z1 and Z2 for a given condition p, the structural analysis can be run to verify the resulting performance. Saving the result of analysis for a grid of points on the latent space results in additional Z dimension and thus creating a map that visualizes areas of better and worse performance. Each performance condition creates a unique map. The best results are generated with performance value p = 0. With increased p, the performance of the samples is worse, however those are still relatively well performing samples, looking at the overall dataset. The following figure shows the example of inputs and outputs for a hops component as well as 3 performance maps obtained in the case study.
INTERACTIVE WEB APP
WEB INTERFACE FOR VISUALIZING RESULTS
Figure below shows an example of an interactive web interface created for the case study that can be found at the LINK.
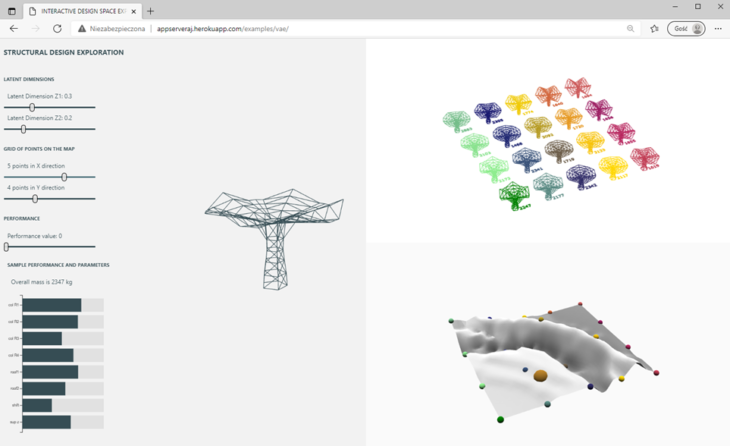
The web application was created with the use of Compute Rhino3d appserver. (10). This tool enables wrapping complex logic of grasshopper definitions into an easy to use interactive web interface. The geometry can be modified with sliders and others user actions. This can be achieved using a workflow consisting of nodel.js and compute rhino3d servers that enable hosting and solving grasshopper definitions with modified input parameters.
The window is divided into 3 parts, with canvas that allow exploring the geometries by zooming and rotating. On the bottom right there is a performance map for a given p value. X and Y coordinates on the map correspond to the points in the latent space, while Z coordinate corresponds to a scaled performance value. A grid of points on the map was established in order to visualize the variation of geometries generated by decoding the points on the map.
On the top right there are geometries generated by decoding the points on the grid, color coded as the points on the map below. Next to the geometries there is a corresponding value of performance, scaled back. In the case study, it corresponds to a total weight of the structure in kilograms.
The left part of the window is dedicated to interactive “walk” on the map. The geometry on the left is generated using parameters that come from decoding a point with coordinates Z1 and Z2 in the latent space. Z1 and Z2 can be controlled by sliders in the top left corner. This point is visualized as the larger, orange sphere on the map in the bottom right. By moving the slider, the points and geometry is automatically updating, this allowing for interactive exploration. The following sliders control the number of points on the grid in X and Y directions. The last slider allows changing the target performance for the samples. Best performing samples are obtained with p set to 0. By increasing p value, performance condition can be relaxed allowing for further exploration of different geometries. The final part contains a bar chart showing the parameters that generate the geometry as well as total mass of the structure. The chart updates with each change of Z1 or Z2 coordinate.
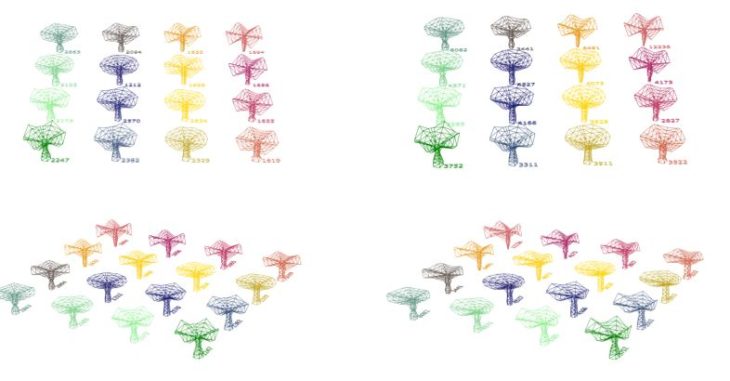
Following figures show a gird of samples for performance values equal to 0 and 1. The geometries generated with p=0 tend to be symmetrical. The samples on the bottom tend to cantilever more to one side, additionally some of them have very small radius on the support level. These factors indicate worse structural performance and thus explain larger overall weight of the structure. Changing the p value allows to visualize possible connection between visual aspects and performance and make informed decision based on both factors.
CONCLUSIONS
Current techniques and resources available online allow to customize Machine Learning techniques to apply artificial intelligence in the architecture and engineering practice. The case study proved that state of the art research on the use of Variational Autoencoders into design space exploration can be successfully applied to a small scale geometry visualized using the tools commonly used in AEC practice, such as Rhino and Grasshopper environment.
Hops component enabled bringing machine learning libraries in python environment into Grasshopper. The workflow using Compute Rhino3d appserver proved to be an effective way of sharing the data to the web, as it required only basic understanding of javascript and allowed most of the work to be done within Grasshopper. While it was possible to use Hops and appserver together, the computing time did not allow for a truly interactive experience. To mitigate the issue with the speed of interaction, values creating the performance map were saved for a multiple values of performance condition p.
NEXT STEPS
As during design process there are often many conditions that need to be taken into account, including contradicting conditions, the proposed workflow could be expanded to allow for multi objective analysis. Further iterations with VAE training could be explored to create better data encoding. User interface and web app could be optimized to improve the speed of interaction. This would be important for the use of larger scale structures, with bigger number of parameters. The step by step workflow, parametric model as well as Machine Learning training code was published on GitHub at this LINK with the intention of contributing to the open source community. The code can be used and adjusted to fit the need of small scale examples and allow expanding to larger and more complex structures.
Design Space Exploration with VAE is a project of IAAC, Institute for Advanced Architecture of Catalonia developed in the Master in Advanced Computation for Architecture & Design in 2020/21 by: Students: Aleksandra Jastrz?bska Faculty: David Andrés León
REFERENCES
- Mueller, Caitlin T. Computational Exploration of the Structural Design Space . 2014.
- Renaud Danhaive, Caitlin T. Mueller. Design subspace learning: Structural design space exploration using performance-conditioned generative modeling. 2021.
- Lukas FUHRIMANN, Vahid MOOSAVI, Patrick Ole OHLBROCK, Pierluigi D’ACUNTO. Data-Driven Design: Exploring new Structural Forms using Machine Learning and Graphic Statics. 2018.
- Pan, W. , Sun, Yimin , Turrin, M. , Louter, P.C. , Sariyildiz, I.S. Design exploration of architectural geometries and structural performance for sports arenas based on SOM-clustering and structural performance simulation. 2019.
- Nathan C. BROWN, Caitlin T. MUELLER. Automated performance-based design space simplification for parametric structural design. 2017.
- Rocca, Joseph. Understanding Variational Autoencoders (VAEs). Link accessed 07.2021.
- Wikipedia. link. Accessed 07.2021.
- Kristiadi, Agustinus. Conditional Variational Autoencoder: Intuition and Implementation. Link accessed 07.2021.
- Chollet, Francois. Building Autoencoders in Keras. Link accessed 07.2021.
- Luis E. Fraguada, Steve Baer, Will Pearson. Rhino Compute AppServer GitHub Repository. Link
- Nathan C Brown, Caitlin T Mueller. Design variable analysis and generation for performance-based parametric modeling in architecture. 2018.
- Renaud Alexis Danhaive, Caitlin T. Mueller. Combining parametric modeling and interactive optimization for high-performance and creative structural design. 2015.
- C. Mueller, J. Ochsendorf. An Integrated Computational Approach for Creative Conceptual Structural Design. 2013.
- Francois, Chollet. Variational AutoEncoder. Link accessed 07.2021.
- Karla Saldana Ochoa, Patrick Ole Ohlbrock, Pierluigi D’Acunto. Beyond typologies, beyond optimization: Exploring novel structural forms at the interface of human and machine intelligence. 2019.
- Nathan Brown, Caitlin Mueller. Designing With Data : Moving Beyond The Design Space Catalog. 2017.