
INTRODUCTION
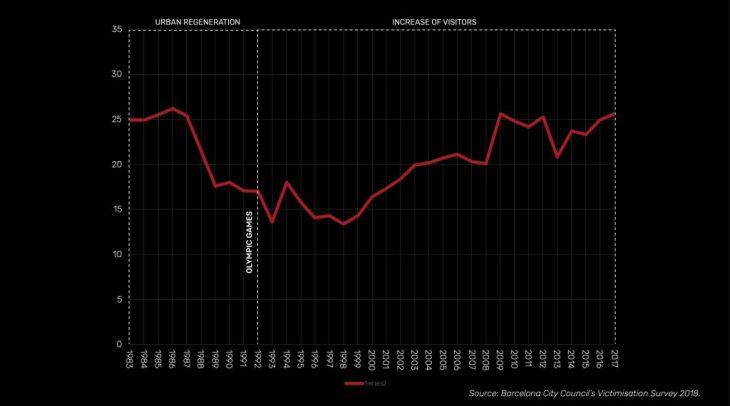
Crime in Barcelona has been increasing in the past two decades as shown in the victimization index. This coincides with the 1992 Olympic games and the rapid increase in tourists and visitors that followed. It is important to note that Barcelona was hugely successful in decreasing crime in the 1980’s thanks to the urban regeneration plan and the investments leading up to the Olympics. In 2017, the victimization index reached the same rate as the worst year of the 1980s. It is high time to re-examine urban policies to reduce crime in Barcelona taking into account of the phenomena associated with global cities and digital society.
RESEARCH OBJECTIVE
According to the United Nations Office on Drug and Crime (UNODC), multiple factors influence crime including situations and environments related to individual, family, community, national society and global society. Some are related to values and norms, while others are related to policies, economy and politics. Crime Busters focuses on the national and global society, in particular, unemployment rate, income inequality, population density, immigration, and tourism in order to investigate the factors affecting crime in Barcelona

DATASET
The project used monthly data of 73 neighborhoods over three years (2016-2018) from Guàrdia Urbana de Barcelona (managed incidents), Instituto Nacional de Estadistica (overnight hotel tourists), and Airbnb (overnight Airbnb tourists), among others, to analyze the correlation between criminal incidents and factors affecting crime.

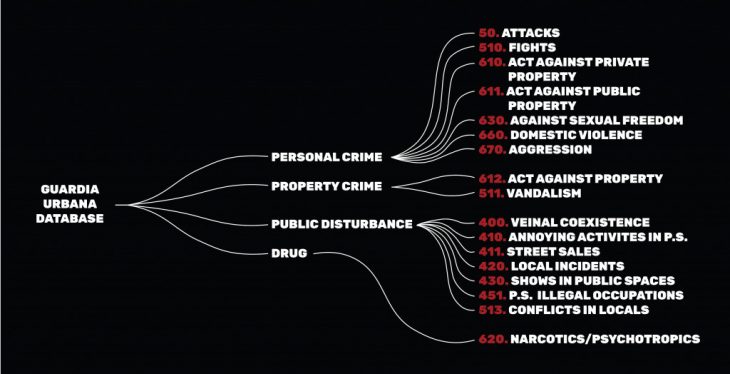
The dataset from Guàrdia Urbana consisted of 97 different reported incidents. Relevant incidents were selected and categorized into 4 categories: personal crime, property crime, public disturbance, and drug.
ANALYSIS
The analysis looked into the correlation of the four different categories of criminal incidents (personal, property, drug and public disturbance) and factors that are potentially affecting crime. The correlation is visualized in maps, scatter plots and line graphs.
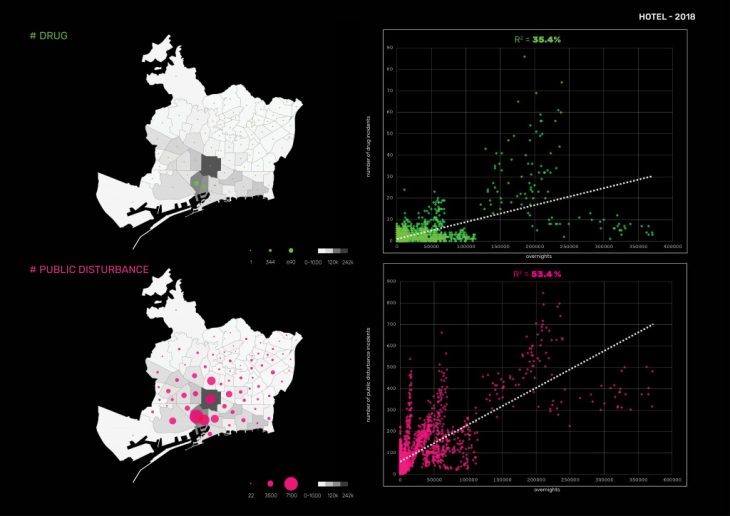
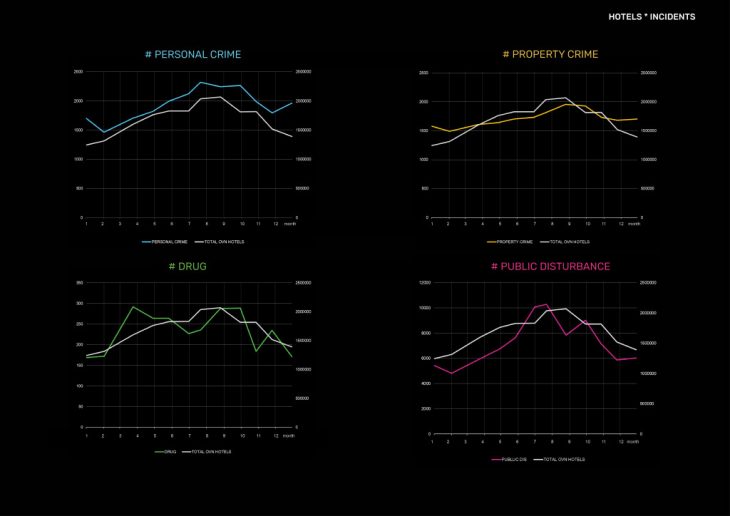
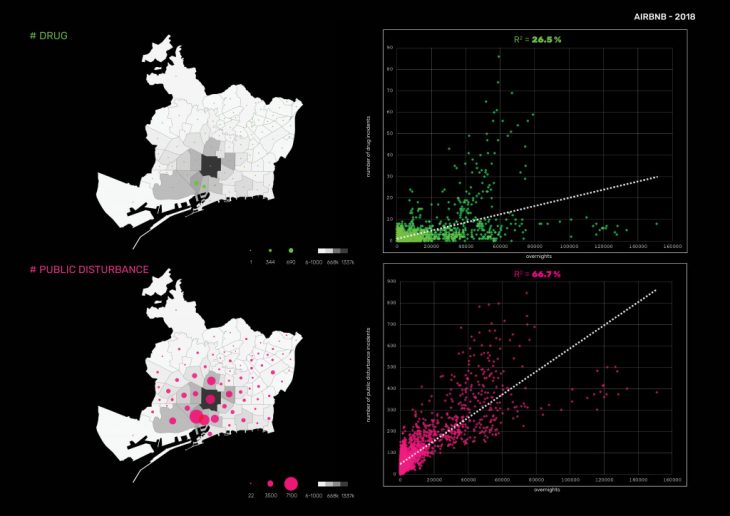
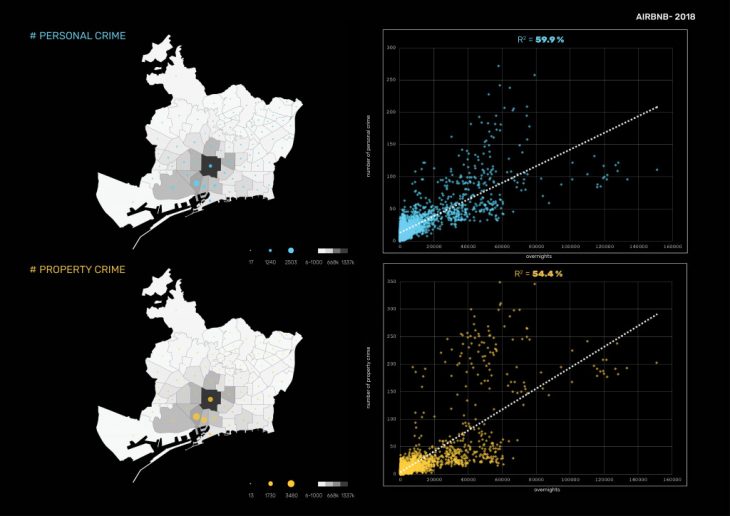
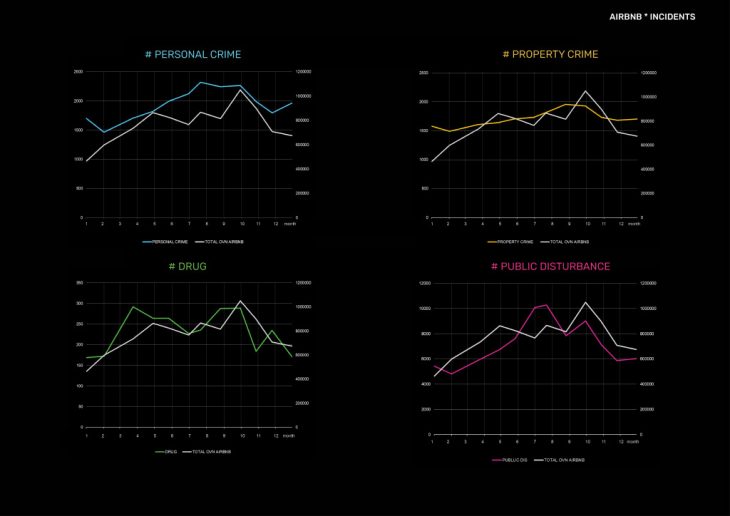
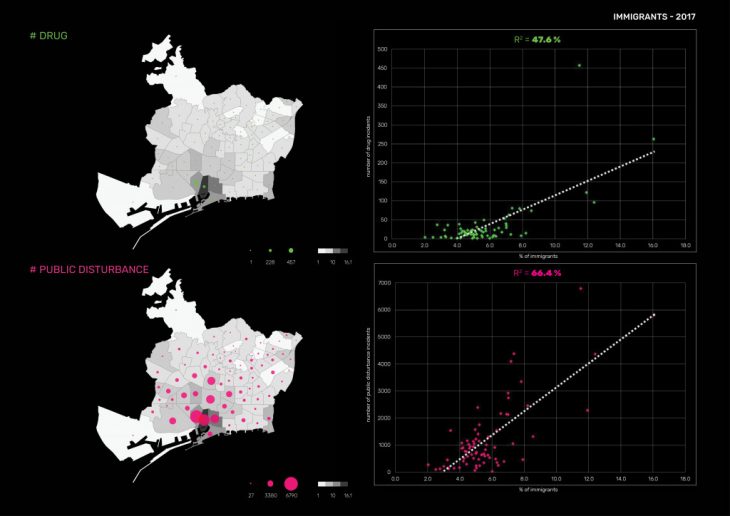
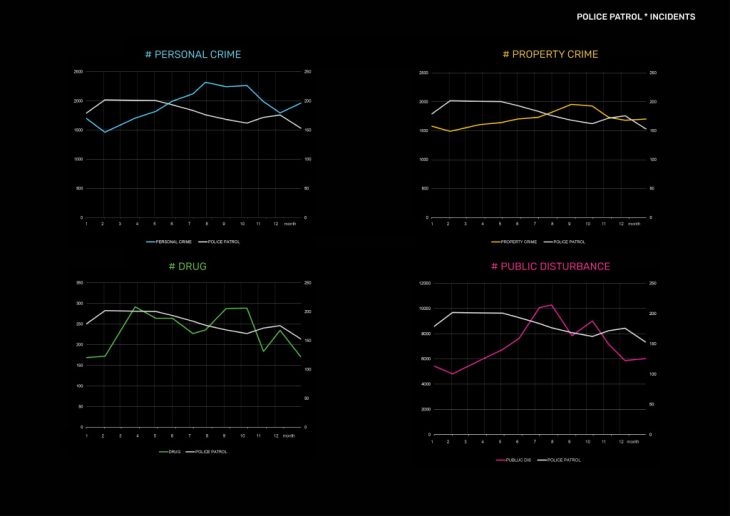
Map: The radius of the points on the maps represent the number of incidents reported in each neighborhood in a given time period. The gradient of the neighborhoods in the maps represent the factors and their intensity that are potentially affecting crime. Scatter plot: The scatter plots graphically represent the correlation between crime incidents (Y axis) and the factors that are potentially affecting crime (X axis). If the observations show an uphill pattern as they move from left to right, it indicates that there is a positive correlation. On the other hand, if the observations show a downhill pattern, this indicates that there is a negative correlation. If the observations do not resemble any kind of pattern, there is no correlation. R2: R squared is the linear regression result of the two data sets: crime incidents and factors that are potentially affecting crime. The percentage represents the degree on which the factors of crime can explain the variance in crime incidents. For example, if the R squared is 80%, it means that the selected factor can explain 80% of the variance in crime incidents, showing a high correlation between the two datasets. Line graph: The line graphs show the correlation of crime incidents and factors affecting crime over time. They visualize the seasonal variation of crime incidents and factors affecting crime over one year.
The factors with the highest correlations are: HOTEL OVERNIGHTS vs INCIDENTS (2016 to 2018)

AIRBNB OVERNIGHTS vs INCIDENTS (2016 to 2018)
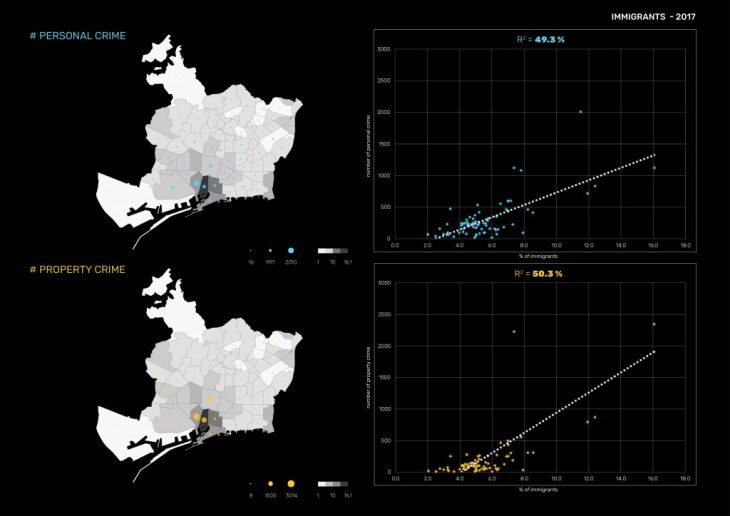
IMMIGRANTS vs INCIDENTS (2017)
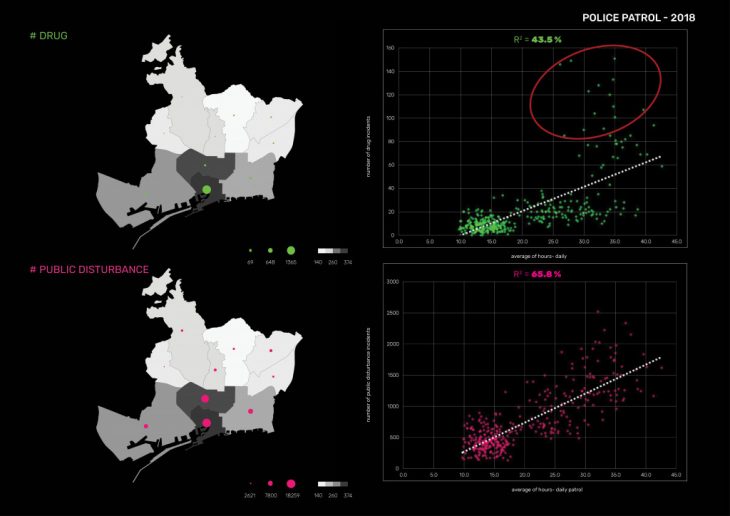
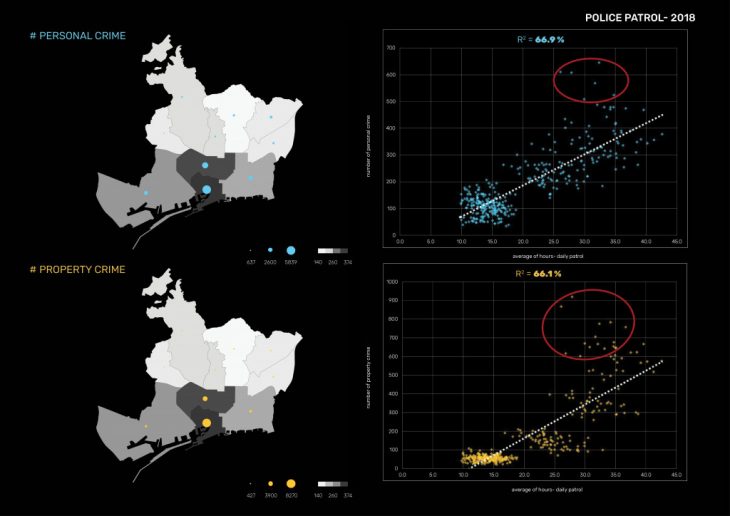
POLICE PATROL vs INCIDENTS (2018)
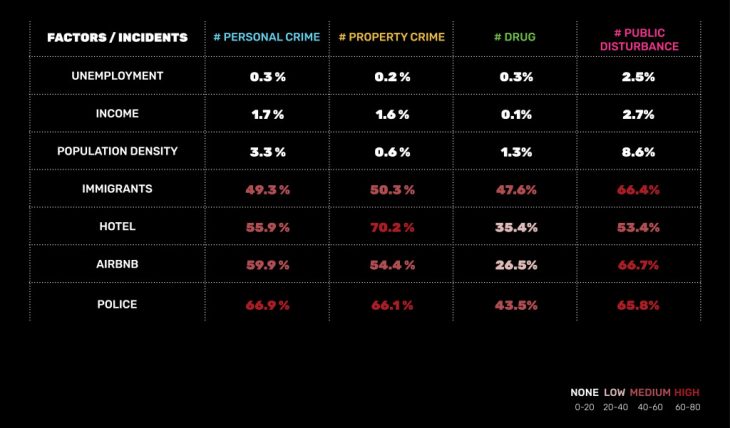
SUMMARY OF CORRELATION
Unemployment rate, income and population density did not have correlation with crime incidents. Immigration had medium R squared value, but had a high P-value suggesting that it is not a reliable indicator that explains the variance in crime incidents.
On the other hand, hotel and Airbnb overnights had medium to high correlation with personal crime, property crime and public disturbance. Hotel overnights showed high correlation with property crime while Airbnb overnights had high correlation with public disturbance.
Police patrol hours had medium to high correlation with crime incidents suggesting that police patrol hours are more or less meeting the needs of the city. The observed outliers were all from Cituat Vella district suggesting that more police patrol is needed in the particular district. Below is a table summarizing the correlations found in the analysis.
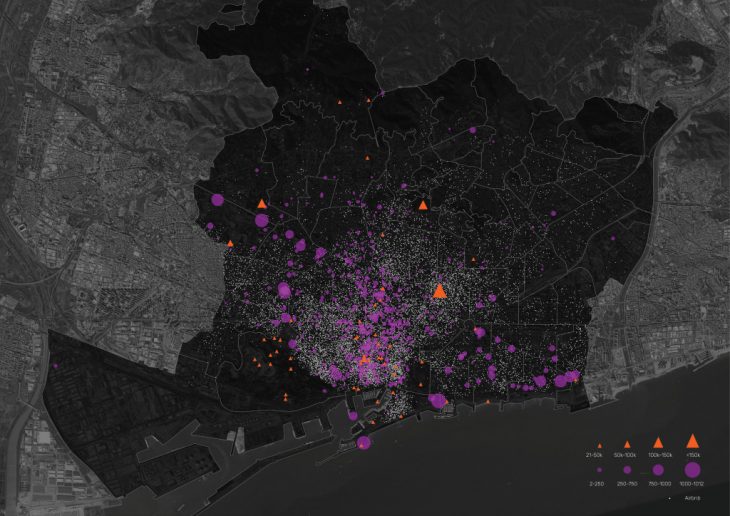
HOTEL vs AIRBNB
Further analysis was carried out to examine the difference between hotel and Airbnb tourists and their different impact on crime. The map visualizes the locations of tourist attractions, hotels and Airbnb apartments. Hotels are concentrated around tourist attractions, event venues and business establishments. Airbnb apartments are located in similar locations to that of hotels but more distributed across the city.
In addition, 5 different neighborhoods were selected according to the existence or non-existence of hotel and Airbnb apartments, categorized as HIGH or LOW in the table below. These neighborhoods were compared according to the density of different inhabitants per 1 hectare of public space and their crime incidents.

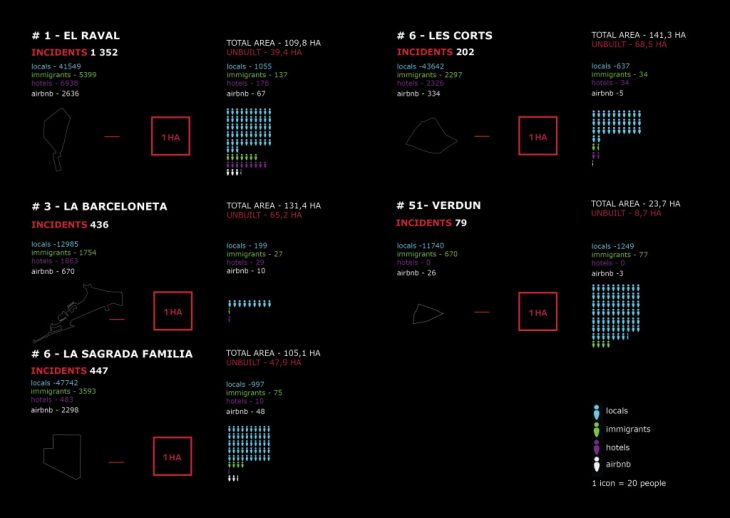
CONCLUSION OF THE ANALYSIS
Five neighborhoods namely, El Raval, Les Courts, Sagrada Familia, Verdun and La Barceloneta were compared to further examine the different impact of hotels and Airbnb on crime incidents in the city and to further confirm the regression analysis conducted.
El Raval vs Verdun: The density of local population does not affect the number of crime incidents. La Sagrada Familia vs Verdun: The density of immigrant population does not affect the number of crime incidents. Verdun vs other neighborhoods: The density of tourists, regardless of hotel or Airbnb, has high correlation with crime incidents. Les Courts vs La Barceloneta: Crime incidents are higher in La Barceloneta although the two neighborhoods have the same tourist density. This difference may be explained by the existence of more tourist attractions in La Barceloneta, which increases the tourists density in public space during the day.
If real time data on crowd level in public space and geolocated crime incidents were readily available, a more accurate analysis on crime would have been possible. Based on the above conclusion, we propose the urban policies below.
URBAN POLICIES
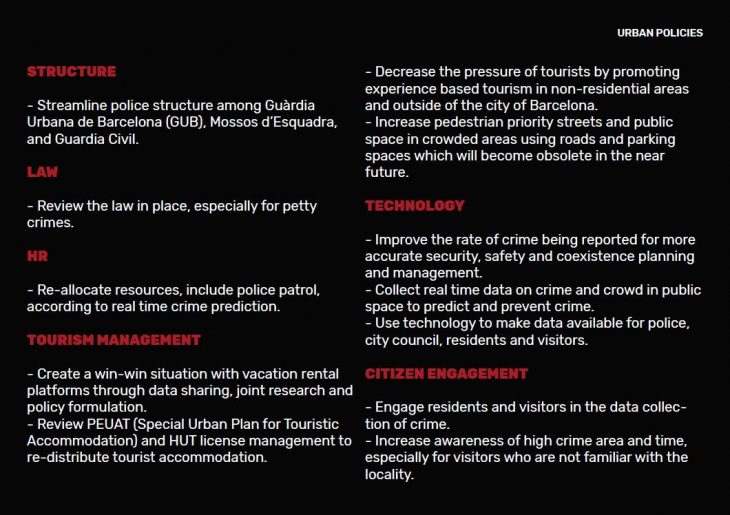
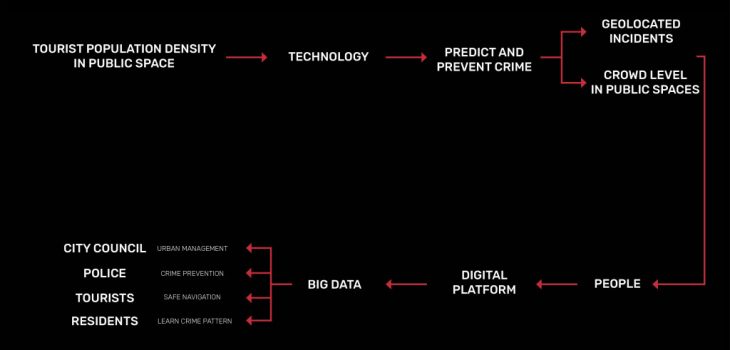
POLICY IMPLEMENTATION: TECHNOLOGY AND CITIZEN ENGAGEMENT
The proposed policies on technology and citizen engagement could be implemented in the following manner. First, real time data on population density in public space will be gathered using the most appropriate technology. Second, the data collected will be used to inform people, especially tourists, on the crowd level of public space in the city. Thirdly, people will be able to report crime on their digital devices and alert others of the crime they have experienced. Lastly, real-time data on crowd in public space and geolocated crime will be aggregated as big data for the city council to use for better urban management, for police to effectively prevent crime, and for tourists and residents to navigate the city safer.

Crime Busters is a project of IaaC, Institute for Advanced Architecture of Catalonia
developed at Master in City & Technology in (2018/2019) by:
Students: Sarine Bekarian, Luna Nagatomo, and Polina Skorina
Faculties: Luis Falcon, Diego Pajarito