Capturing Social Value, Municipality Planning Tool.
How can we mine data from popular websites such as TripAdvisor and Foursquare?
How Python and Scrappy can help municipality analyzing social patterns in a city?
What kind of conclusions can be drawn from such social patterns and how they can help the municipality to make more informed policies?
The seminar, Big data and Digital tools II intends to answer these questions. Tools and techniques acquired throughout the process will supplement research in a studio ‘Internet of People’ for identifying potential parts of the city and make policies for creating a circular and more equitable society.
Land value vs Social value
New technologies should allow for the development of inclusive policies depending of the different social values that we can found inside of the urban life. Again, the so-called information society should develop mechanisms for transmitting information to society in a transparent way, so that it can be interpreted for the purpose of decision making, both by city governments and by citizens. Any decision concerning how human activities, and the associated spaces, are organized implies a different quality of life, and a different cost/benefit ratio. In any case, the idea is not that every citizen should do everything for him or herself, literally. The idea is to use the potential inherent in the local production of resources, based on knowledge that emerges from information networks, so that the production of resources serve to create a more united society. The regeneration of cities based on the model of networked self-sufficiency. only makes sense if it allows people to exert more control over their own lives and if it gives them more power, as part of a social network.
Create Urban Equality, Collective Creativity and use Technology as a Tool are the main ideas for this project.
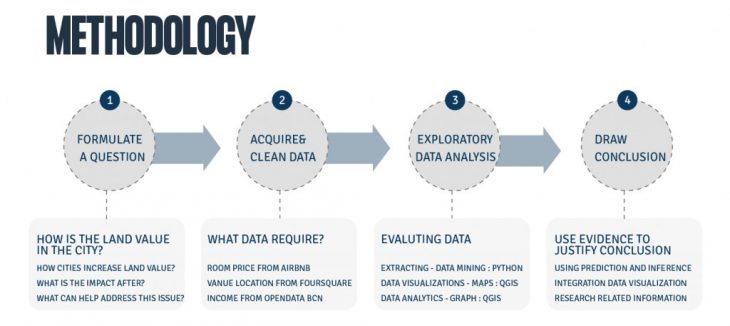
Methodology Capturing Social Value
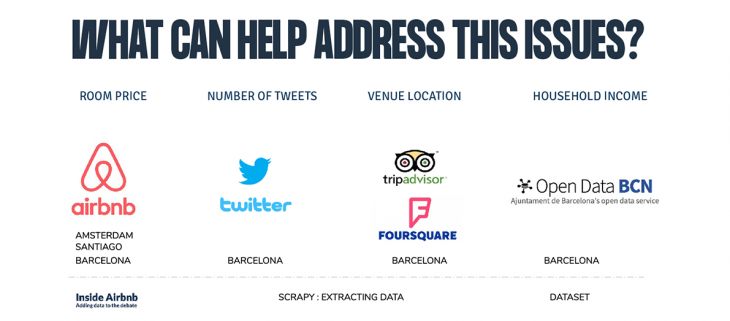
API Data Sources
Reprogramming decision making by using technology means rewriting the lines of code for the actions we carry out each day, so that they can happen more efficiently, using fewer resources, managing more information and promoting more social equity. The objective of this project is using data in order to create a ‘Planning Tool for municipality’ understanding the conditions of social indicators in the city. Hence The project mines, cleans, visualize, analyze data from Trip advisor, Foursquare by using Python, web crawling frame work Scrappy and APIs such as OpenCage.
Venues map from Trip Advisor & Foursquare
The Venues density (equipment’s, mobility stations, facilities, commerce, restaurant, etc.) gives insight into information about the conditions of suitability in the city. In this case, more than 50000 venues from Foursquare and Trip advisor are obtained and geolocated using the API, OpenCage.
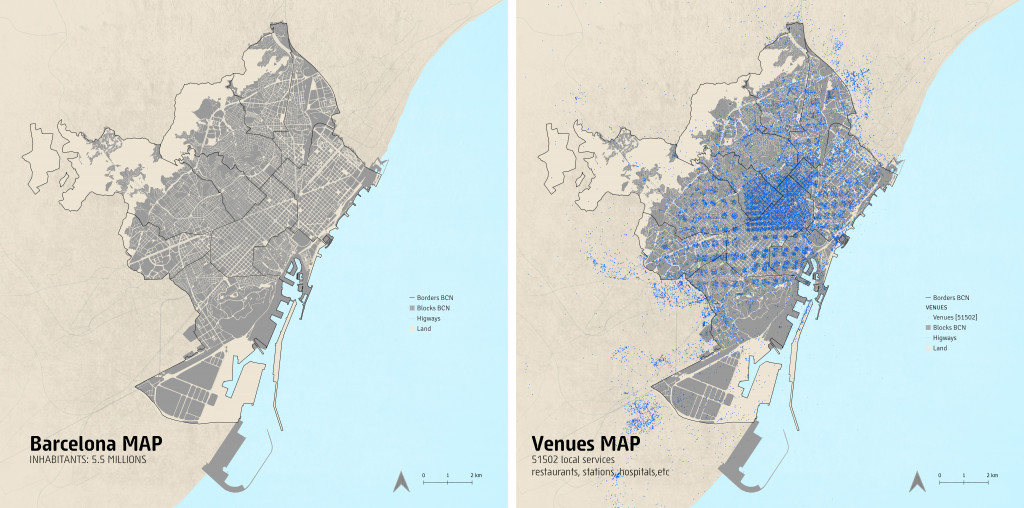
BCN MAP vs BCN Services
Most of the landmarks and touristic attractions are concentrated in the central part of the city. This leads to a development of more infrastructure, and business such as restaurants and commercial areas that further swell price of the land.
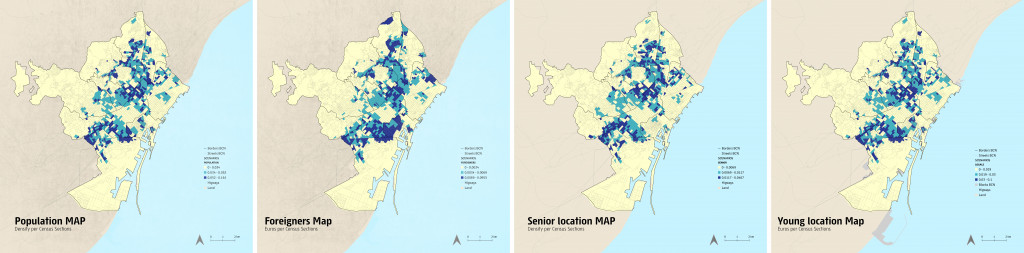
Data from “Open Data BCN” informs our understanding of spatial income distribution in the city. Average family income of Northern and Southern barrios is relatively lower which could be areas of interest. The map above represents comparison between venues density and spatial distribution of average personal income in barrios and the population. The first map shows the entire population and the location foreigners, seniors and young people live. The relationship between service, family income, who live in each area. The expansion of the city growing up to the east north of the city.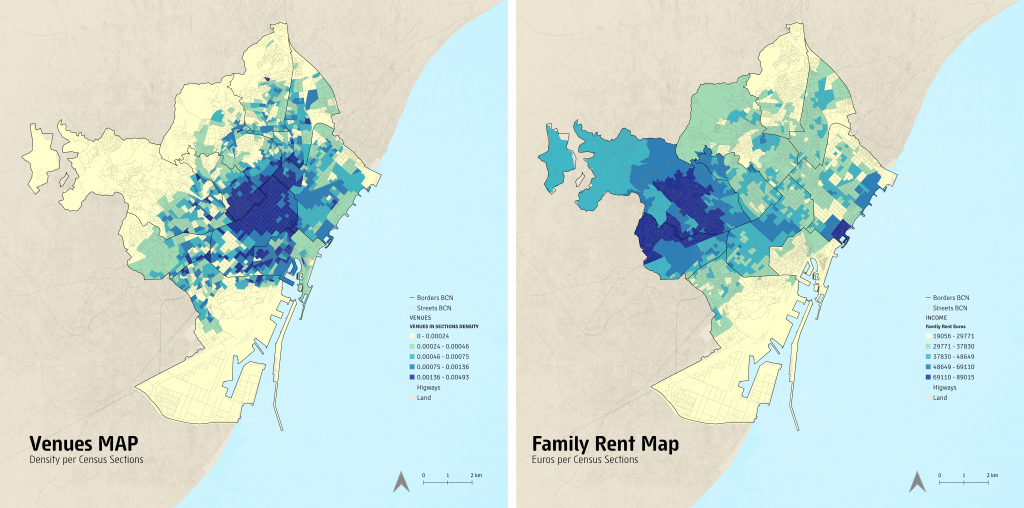
Census Section Data Analysis
Analyzing and visualizing data create strong evidence to justify the conclusion for a question we asked; how is the land value in the city. We can see from Venues map that the area around landmarks is higher priced than other areas. Not only landmarks can increase land value in the city but there are different factors to land value depending on the context of each city. From family rent maps, it represents differences from venue maps such as Sarrià-Sant Gervasi and Gracia, the northwest part of Barcelona is the most expensive rental rate in Barcelona (average rent is about 16 Euros/square meter). This area has developed to offer a wide range of shopping centers, lots of green park, amazing architecture, quiet streets, tranquility and the fact that is located far away from the most touristic parts of the city. Creating a good environment to live also increases land value. Not only geography but also people moving can be another factor such as city centers like Eixample will be more expensive until people can not live there and they have to move to neighborhoods where it is cheaper. Then the surrounding will also price up following people who live there.
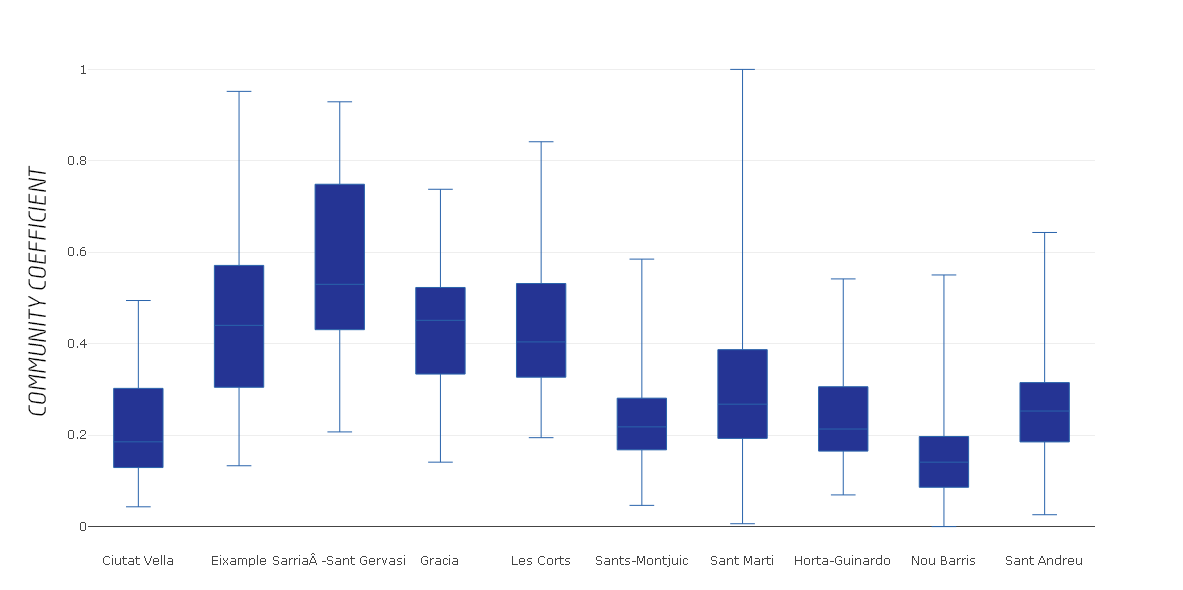
Social Value Coefficient by District
The graphic and next maps illustrate the relationship of service (venue) and family income that is evident and the city center attracts high income population and services together and it distributes to the north of the city so the next possible expansion area suggests a blue area where there is less service and people are not wealthy as city center. It will be a challenge to develop following the new citizen-centric system of land value in the age of Big Data by (Internet of People). Developing a new Municipality Planning Tool.
Policies:
- Collective Creativity: City council policies to allow circular design projects to construct community by diversifying people activities and promoting collective creativity in age of automation.
- Technology as a Tool: City council policies to allow the design and construction of infrastructure and public space by technological companies in Barcelona as a city lab.
New technologies related to data science can enable decision makers to make policies for inclusive development depending on the different social values that exist in urban life. Again, the so-called information society should develop mechanisms for transmitting information to society in a transparent way, so that it can be interpreted for the purpose of more informed decision making, both by city governments and by citizens.
‘Capturing Social Value, Municipality Planning Tool ’ is a project of IaaC, Institute for Advanced Architecture of Catalonia developed at Master in City & Technology in (2019/2020) by:
Student: Byron Cadena, Pawitra Bureerak & Akshay Marsute
Faculty: Diego Pajarito