INTRODUCTION
In today’s time where the world is coping with a global pandemic, cities have become the frontier for the actions required to curb the effects of the pandemic. This creates multiple new challenges to re-imagine the way we design, operate and use the spaces. One of these challenges is organizing public spaces with the new norms. This brings our attention to one of the most dynamic spaces in a city, the plaza. Always having played a pivotal role in shaping the culture and social life in the city we want to investigate how we can redesign and reorganize this fundamental space to effectively bring it back to the citizens.
The experiment is driven with the use of YOLO algorithm to detect all sorts of elements on a video. What can we learn from this tool and how can data play a pivotal role in the pandemic crisis and the way we use the spaces?
Can we make public squares datasets more compatible, scalable and comparable across different cities or across different parts of the city? How these metrics would inform urban policies and programmatic events?
Under this context we started our project by understanding how this has been done already. Studying pedestrian behavior on public spaces is not new and we can see it for example in the study by William H. Whyte of the Seagram Plaza or the ‘Rediscovering the Centre (1988)’ with an intersection between Fifth Avenue and Fiftieth Street.
More recently offices like Space Syntax have made good use of the new technologies to redesign emblematic spaces such as Trafalgar Square in London or the old market Square in Nottingham.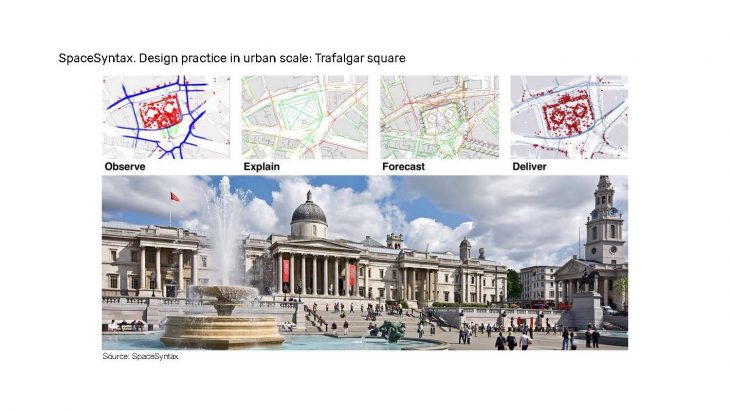 Our source of information in this case are 4 online websites cameras of 4 emblematic squares of Europe. We have chosen these 4 due to the quality and availability of the videos but also because of the importance of the square on the cultural and social life of the European Cities.
- Market Square, Bruges, Belgium
- Puerta del Sol, Madrid, Spain
- Piazza del Duomo, Milan, Italy
- Tartini Square, Piran, Slovenia
OBJECT DETECTION
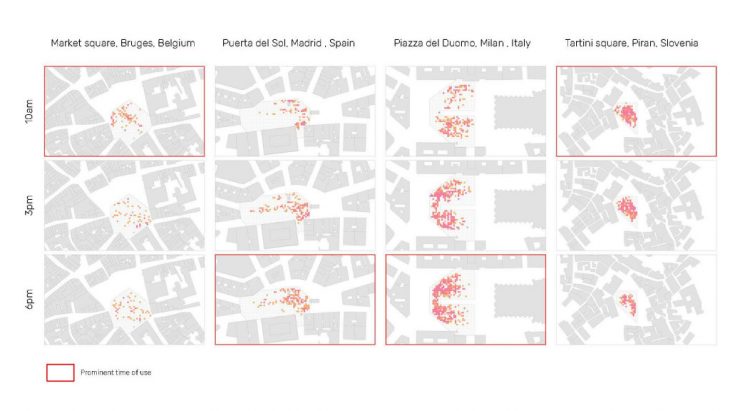
In this stage, we performed a 10 minutes screen recording of each location during 3 different times of the day. The chosen times that are used in the video are during the ‘pandemic rush hour’, which happens daily between 10 – 10:30AM, 15 – 15:30PM, 18 – 18:30PM. We then used the recordings to run YOLO algorithm to get the object detection, and later create an object mapping to carry out the urban analysis.
VIDEO MAPPING
If we place together all the analysis, we can extract interesting conclusions on how the different characters or what the square is commonly used for. In Madrid for example the space is used mainly as a place where people pass by when in Milano the piazza perform more a scenography role with people taking pictures of the cathedral.
STRATEGY INTERVENTION
Now, how can these analyses could make an impact on the reprogramming of the space? What if we could use it as a tool to understand where to place events on the city based on statistical historical data of how many people we would expect? And what if the municipality would have the data to compare different public spaces in order to make a decision of where to allocate different types of events? Or what if even this could be used as a tool to reactivate different parts of the city, decentralizing and de-congesting busy areas of the city through interventions or events?
How these events could be allocated based on the performed analysis and depending on the type of event? Where would we place markets and where would we place open theaters or Tourist Information Centers without disrupting the flows of the people? Can these be also a tool to control flows of riots in real time or knowing where to allocate resources like first aid or paramedics in order to improve preparedness?
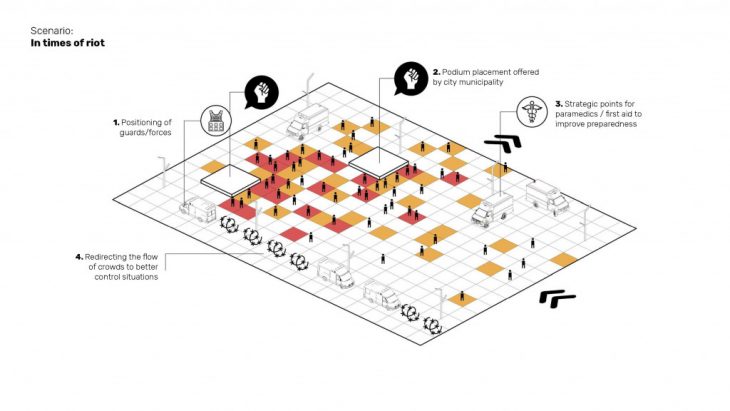
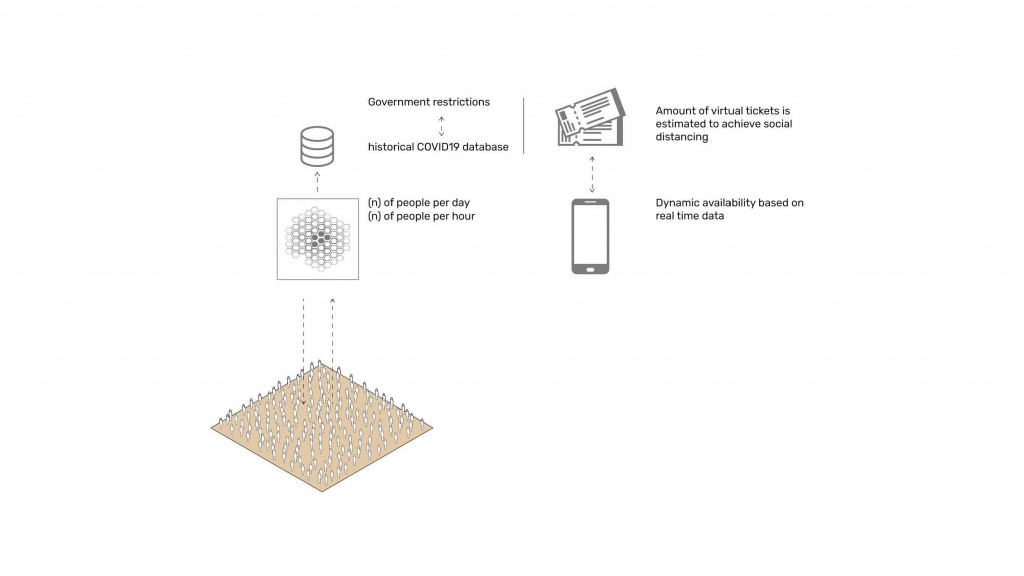
PANDEMIC WORLD
What if in a COVID-19 scenario where we want to keep social distancing between assistants to an event, we can offer a limited amount of tickets that are controlled in real time through tracking technology?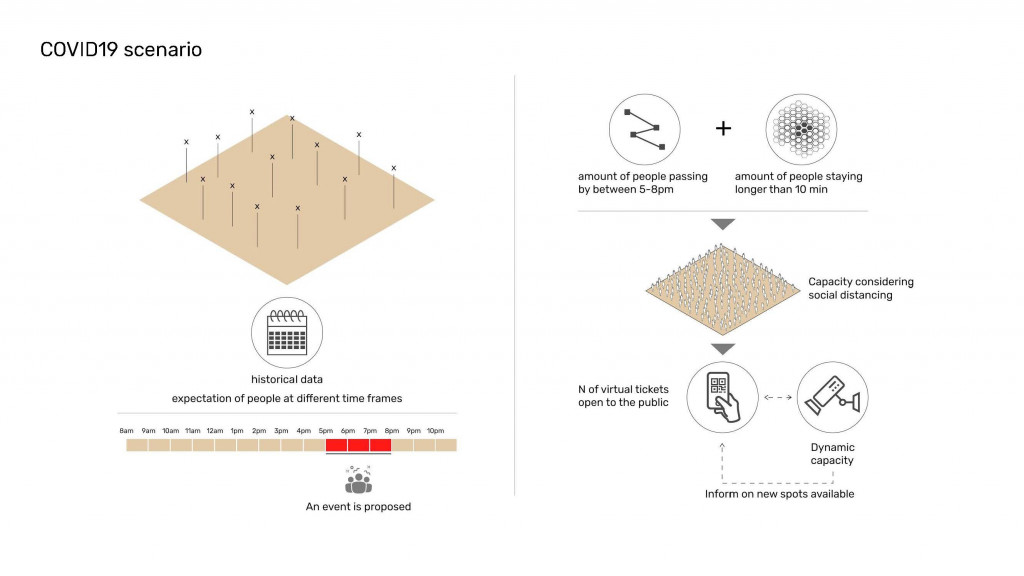
CONCLUSION
As a collective and highly dynamic social group, the human crowd is a fascinating phenomenon which has been constantly concerned by experts from various areas. YOLO can be a powerful tool to monitor the movements of people in a city. Understanding commercial areas, main accessibility points or nearby points of interest would be a way to develop the analysis further in order to understand better the human behavior in every context.
DISCUSSION & FUTURE WORKS
With the introduction of social network services such as Twitter and the widespread use of mobile devices it has become extremely easy to log and gather data of people’s activities and communication. This preliminary study has attempted to understand what kind of data related to a public space can be gathered and how the collected data can be used in the design and construction of public spaces. Because this public data is continuously produced, we envision that it could be used throughout the design process. The relative ease with which the data can be gathered and visualized could allow administrators of buildings to moderately redesign spaces based on the analysis.
REFERENCES & BIBLIOGRAPHY
-
http://www.tinotopia.com/log/archive/2005/10/11/a_trip_to_the_mall.htm
-
http://cargocollective.com/palomagr/filter/architect/SPACE-AND-MOTION-Data-based-rules-of-public-space-pedestrian-motion
-
https://morphocode.com/location-time-urban-data-visualization/
-
https://www.researchgate.net/publication/257714900_Urban_Identities_Influences_on_Socio-Environmental_Values_and_Spatial_Inter-Relations
Capturing Human Behavior in Public Spaces is a project of IaaC, Institute for Advanced Architecture of Catalonia
developed at Master in City & Technology in (2019/2020) by:
Students: Alejandro Quinto (MaCT), Aryo Dhaneswara (MaCT), Ashfaq Fazil (MAA), Kushal Saraiya (MaCT)
Faculty: Aldo Sollazzo, Soroush Garivani, Iacopo Neri