One of the things that have impressed me most of Barcelona is the huge quantity of theaters, well distribute in different parts of the city. I was curious to know understand how was the real distribution in urban context and what is the percentage of utilization of those cultural services. I based my mapping according to two main database: The number of seats available for each season and the amount of tickets sold, referring to the year 2014.The result is interesting, because shows the polycentric attitude that characterize Barcelona, and surprisingly the most utilized theater are located not in the very city center.
Methodology
First step was the collection of datas, found in
http://opendata.bcn.cat/opendata/en/catalog.
Then I have downloaded the .csv file that I was interested in. Once extracted three main list of datas, I combined them dividing them into different lists according to neighborhood, using the equal to command in order to create a pattern for list split.
Second step was rappresented by the combination of datas, in order to understand the percentage of utilize in each area.
To calculate the number of theaters I used the list lenght comand, as an input for extrusion. To calculate the percentage of utilization I divided the number of seats by the tickets sold.
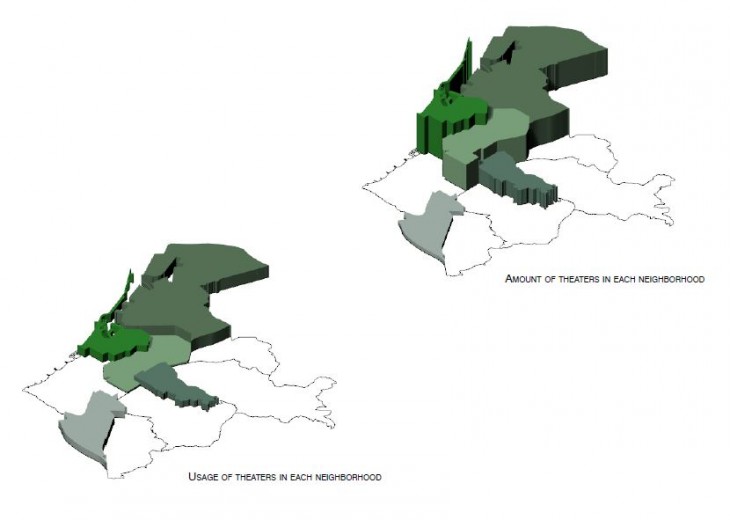
Theather usage mapping