Introduction
The NDVI tool was used to detect the plant carbon sequestration index in the Metropolitan Area of Barcelona. This exercise was part of the Internet of Cities studio, to detect the zones who have a low carbon sequestration, we used this tool to determinate the places of our intervention, to recover the soils of the metropolitan area, to create a strategy to sequestrate the carbon that produce the city of Barcelona.
NDVI Poster
Process
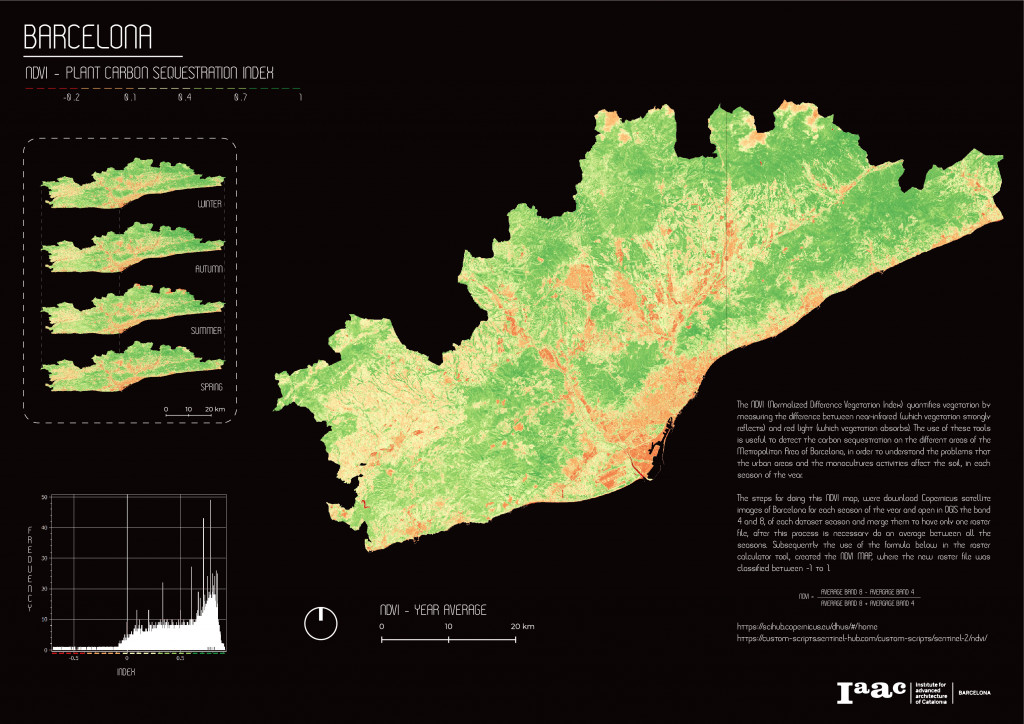
The NDVI (Normalized Difference Vegetation Index) quantifies vegetation by measuring the difference between near-infrared (which vegetation strongly reflects) and red light (which vegetation absorbs). The use of these tools is useful to detect the carbon sequestration on the different areas of the Metropolitan Area of Barcelona, in order to understand the problems that the urban areas and the monocultures activities affect the soil, in each season of the year.
The steps for doing this NDVI map, were download Copernicus satellite images of Barcelona for each season of the year and open in QGIS the band 4 and 8, of each dataset season and merge them to have only one raster file, after this process is necessary do an average between all the seasons. Subsequently the use of the formula below in the raster calculator tool, created the NDVI MAP, where the new raster file was classified between -1 to 1.
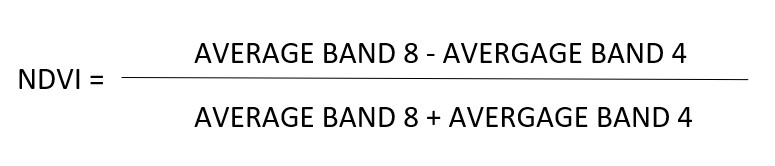
NDVI map formula
Carbon Sequestration per Season
GIF of the carbon sequestration per season in the Metropolitan Area of Barcelona
Sources:
https://scihub.copernicus.eu/dhus/#/home
https://custom-scripts.sentinel-hub.com/custom-scripts/sentinel-2/ndvi/
Barcelona / NDVI – Plant Carbon Sequestration Index is a project of IAAC, Institute for Advanced Architecture of Catalonia developed at Master in City & Technology in 2020/21 by student: Kevin Aragón, and faculty: Diego Pajarito.
