 URBAN TYPOLOGIES & MACHINE LEARNING II
Introduction
This workshop is about how urban planners & decision-makers can use AI and Machine Learning in urbanism led by the City Intelligence Lab team at the Austrian University of technology.
![]()
Context & Research Question
The project’s focus is on the circular economy protocols for the enabling infrastructure of the city ( example: renewable energy solutions) based on the different contexts and patterns of the areas in the city. Machine learning can assist this process to recognize the different typologies in the city, based on the data that is chosen by the decision-maker.
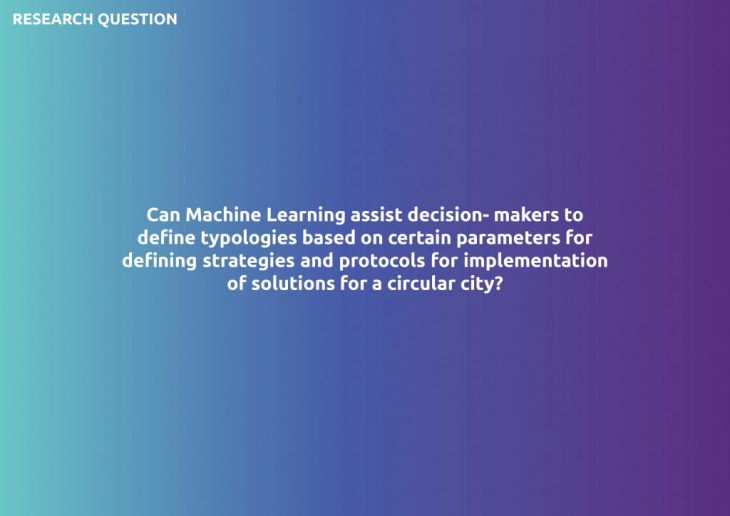
The question addressed in this exercise is “Can machine learning assist decision-makers to define typologies based on certain parameters for defining strategies & protocols for implementation of solutions for a circular city?”
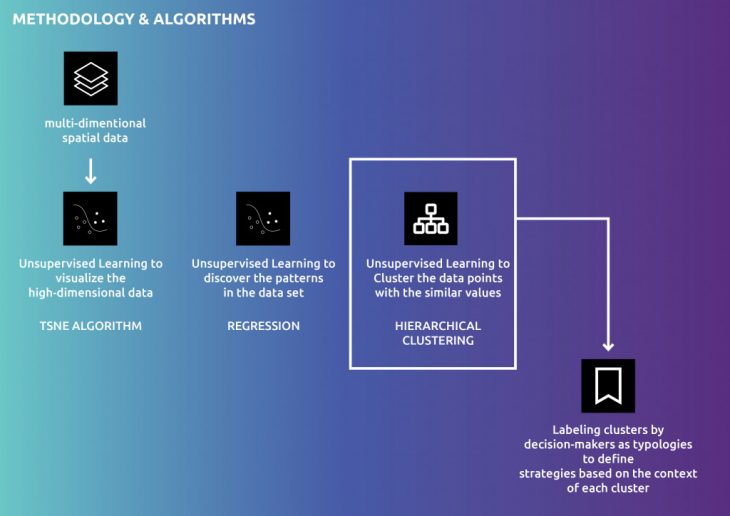
Algorithms
Different types of algorithms have been tested for this purpose. The chosen algorithm to define typologies in this project is the Hierarchical Clustering Algorithm which is an Unsupervised Learning Algorithm.
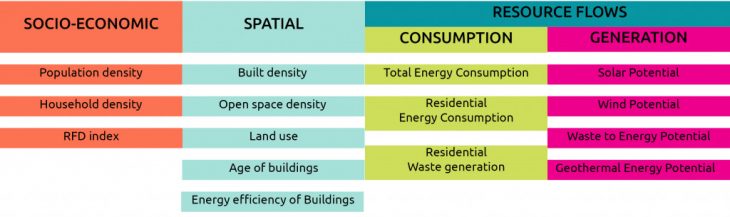
Dataset
The data to define the protocols based on them, is gathered in three categories of:
- Socio-Economic
- Spatial
- Resource Flows ( which has two sub-categories of consumption data & generation potential data)
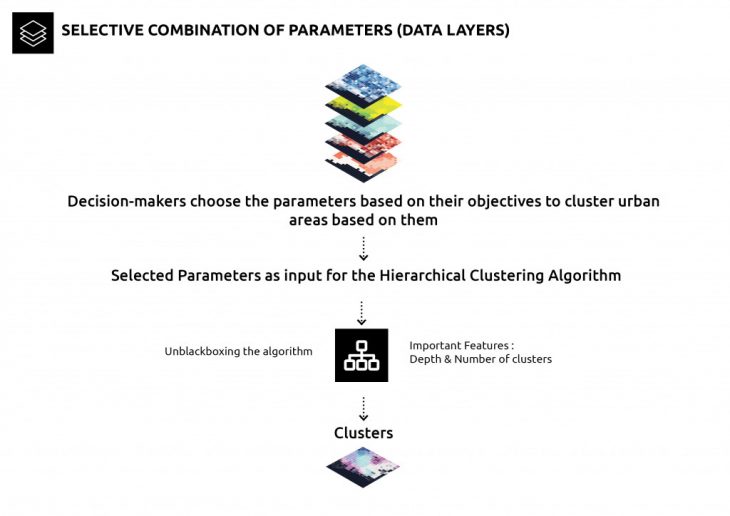
Process
to define typologies, the decision-makers can choose the parameters based on their objectives to cluster urban areas. The selected parameters will be the data input for the Hierarchical Clustering algorithm. The output of the algorithm is the clusters.
Selective Combination Results
Different combinations of data input and the number of clusters were tested with the algorithm. The results are shown below:
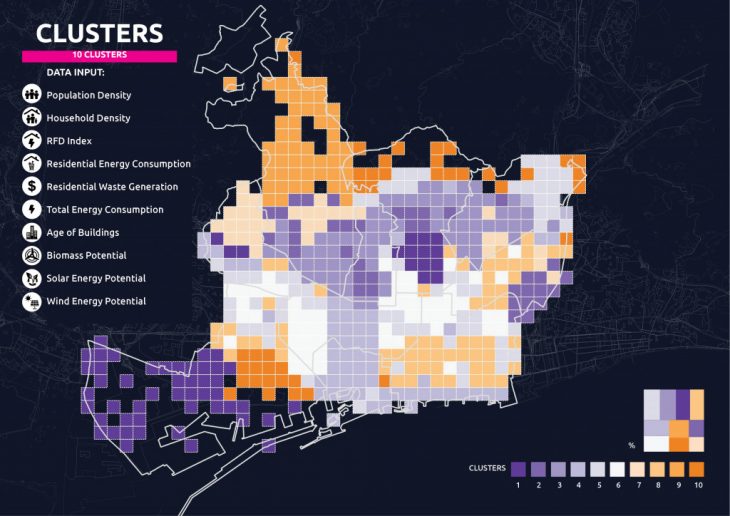
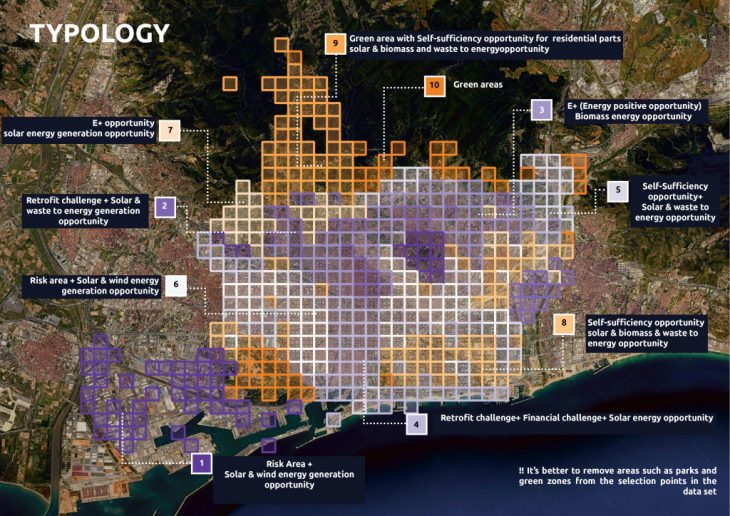
Final Clusters – 10 Parameters 10 Clusters
One of the results is taken to continue the process for defining the protocols. 10 parameters with a combination of all the categories in the dataset is grouped in 10 clusters as shown in the map below:
Understanding the Results
In order to understand the results of the machine learning algorithm three steps are introduced:
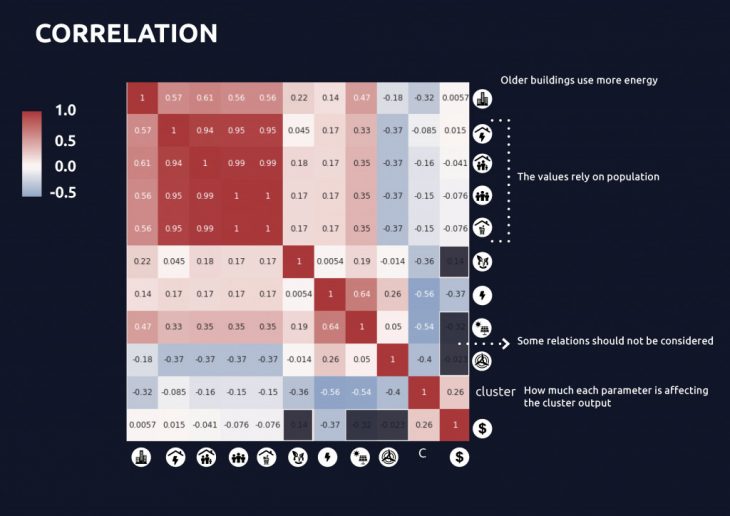
- A correlation matrix to understand the importance factor of each parameter for the final clusters it belongs to as well as the correlation between the parameters.
- visualization of the cluster and each data layer separately to understand the distribution of values among clusters.
- A radar chart showing the average values of each cluster.
Correlation between the parameters
Clusters + Separate Data Layer Visualization
Average Values of Clusters
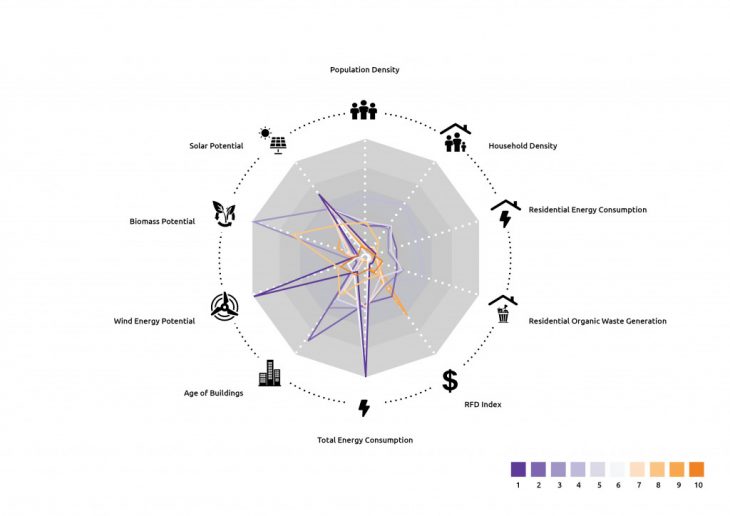
Protocols
Based on the radar chart of the average values of each cluster, the decision-maker can label each cluster for the protocol.
This work is part of “Circular Collective Nexus” project by Mahsa Nikoufar
Urban Typologies & Machine Learning II is a project of IaaC, Institute for Advanced Architecture of Catalonia developed at Master in City & Technology in (2018/2020) by:
Student: Mahsa Nikoufar
Faculties: Angelos Chronis, Nariddh Khean, Serjoscha During