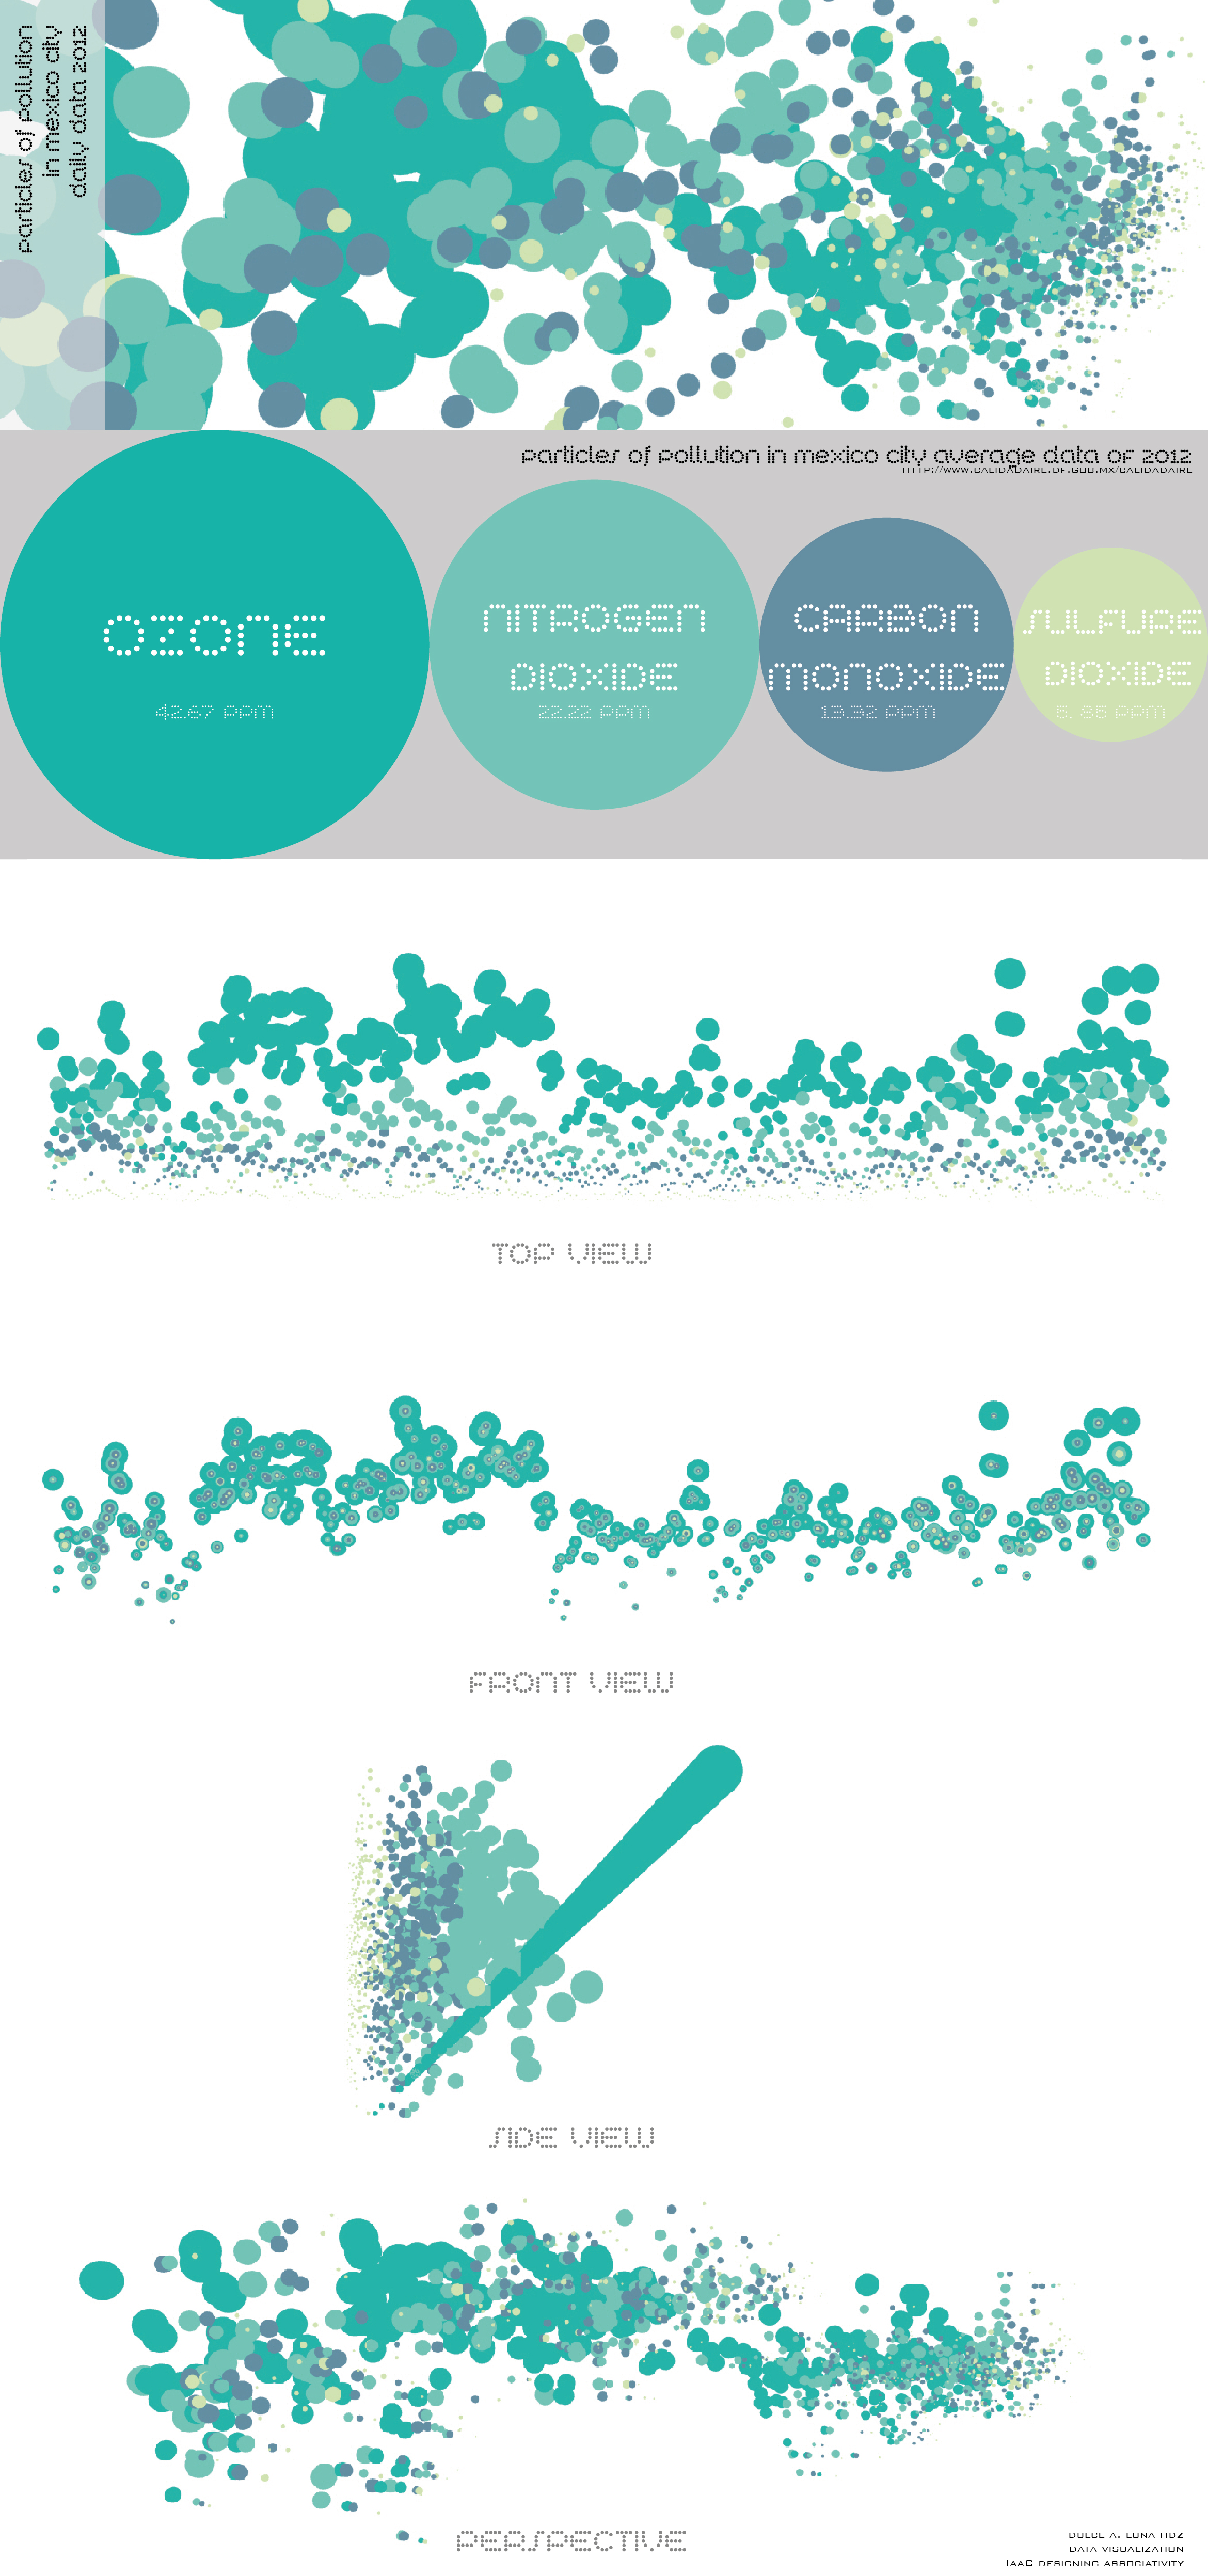
Data Visualization of particles of pollution (Ozone, Nitrogen Dioxide, Carbon Monoxide and Sulfure Dioxide) along year of 2012 in Mexico City. The graphics showed belowed were generated with grasshopper and the data was collected with a .CSV file according to www.calidadaire.df.gob.mx . Each color represents a particle of pollution and the size increase according to the amount of ppm of every day.